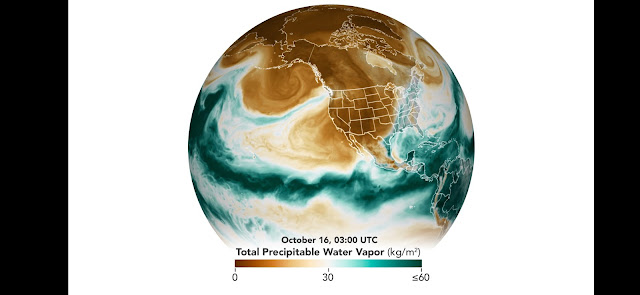
The animation above shows a model of the movement of total precipitable water vapor over the eastern Pacific Ocean from October 10-25, 2021. Green areas represent the highest amounts of moisture. Note the fingers of white to light green that repeatedly flow into the Pacific Northwest of North America. Note also how areas in the tropics are often saturated with moisture that can eventually curl up into middle latitudes.
Total precipitable water vapor is a measurement of the amount of water in a column of the atmosphere if all the water vapor in that column were condensed into liquid. The animation was derived from a NASA product known as the Goddard Earth Observing System Data Assimilation System (GEOS DAS), which uses satellite data and mathematical representations of physical processes to calculate what is happening in the atmosphere. Not all precipitable water vapor actually falls as rain. However, it is a useful indicator of regions where rainfall could be excessive.
(Earth Observatory NASA)
Weather Knowledge - 33
Posted 27th October...
As green chlorophyll fades from trees and plants each autumn, other pigments color the Earth's landscapes. Satellites take leaf-peeping to a whole new level... Images of Various satellite of last few years. (Academic Interest)
Weather Knowledge -32
Jet Streams Importance: (See also Weather Knowledge -17)
Jet stream theory
Jet streams of Earth
This theory tries to explain the establishment of the northeast and southwest monsoons, as well as unique features like "bursting" and variability.
The jet streams are systems of upper-air westerlies. They give rise to slowly moving upper-air waves, with 250-knot winds in some air streams. First observed by World War II pilots, they develop just below the tropopause over areas of steep pressure gradient on the surface. The main types are the polar jets, the subtropical westerly jets, and the less common tropical easterly jets. They follow the principle of geostrophic winds.
Process of monsoon creation
Over India, a subtropical westerly jet develops in the winter season and is replaced by the tropical easterly jet in the summer season. The high temperature during the summer over the Tibetan Plateau, as well as over Central Asia in general, is believed to be the critical factor leading to the formation of the tropical easterly jet over India.
The mechanism affecting the monsoon is that the westerly jet causes high pressure over northern parts of the subcontinent during the winter. This results in the north-to-south flow of the winds in the form of the northeast monsoon. With the northward shift of the vertical sun, this jet shifts north, too. The intense heat over the Tibetan Plateau, coupled with associated terrain features like the high altitude of the plateau, generate the tropical easterly jet over central India. This jet creates a low-pressure zone over the northern Indian plains, influencing the wind flow toward these plains and assisting the development of the southwest monsoon
Jet stream theory
According to this theory, the onset of the southwest monsoon is driven by the shift of the subtropical westerly jet north from over the plains of India toward the Tibetan Plateau. This shift is due to the intense heating of the plateau during the summer months. The northward shift is not a slow and gradual process, as expected for most changes in weather pattern. The primary cause is believed to be the height of the Himalayas. As the Tibetan Plateau heats up, the low pressure created over it pulls the westerly jet north. Because of the lofty Himalayas, the westerly jet's movement is inhibited. But with continuous dropping pressure, sufficient force is created for the movement of the westerly jet across the Himalayas after a significant period. As such, the shift of the jet is sudden and abrupt, causing the bursting of southwest monsoon rains onto the Indian plains. The reverse shift happens for the northeast monsoon.
The jet stream effect
The jet stream theory also explains the variability in timing and strength of the monsoon.
Timing: A timely northward shift of the subtropical westerly jet at the beginning of summer is critical to the onset of the southwest monsoon over India. If the shift is delayed, so is the southwest monsoon. An early shift results in an early monsoon. Strength: The strength of the southwest monsoon is determined by the strength of the easterly tropical jet over central India. A strong easterly tropical jet results in a strong southwest monsoon over central India, and a weak jet results in a weak monsoon.
Weather Knowledge -31
Rainfoot & Microburst in same frame
Weather Knowledge - 30
Sprites...Jellyfish sprites.
Paul Smith just photographed a magnificent display over Kansas on 6th April 2021..
Sprites are a weird form of lightning that leap up from powerful thunderstorms. These are "jellyfish sprites", named for their resemblance to sea creatures. Their red tentacles stretch about 90 km high, almost touching the edge of space.
At this time of year, severe storms set the stage for sprite formation. Mesoscale convective systems sweep across the Great Plains, cracking with intense electric fields that drive electrons up and into sprites. La Niña conditions in the Pacific Ocean may amplify this process.
"I was about 200 miles away from the thunderstorm," says Smith. Turns out, that's about the right distance. You have to be far away to see sprites over the top of the thunderclouds.
Courtesy Spaceweather.com
Weather Knowledge - 29
Simple Identification of clouds.
What are the Secrets to Identifying Clouds? People are particularly interested in learning how to identify clouds and to understand what they imply about upcoming weather. What is meant by the arcane compound names, such asaltostratus,cirrostratus, or the intriguingaltocumulus lenticularis?
Their essential approach was to divide clouds into four types depending on how they look and three classifications based on their heights. First, the four types based on appearance:
Stratus or strato-form layered or sheet-like clouds
Cirrus or cirro-form: thin, wispy clouds
Cumulus or cumulo-form: puffy cotton-ball like clouds that can sometimes have great vertical development
Nimbus: precipitating clouds
Here is an example of a stratus type cloud; you see how layered it is?
A cirrus type cloud is shown below.... delicate and wispy.
cumulus cloud has a characteristic cotton ball appearance, although some folks think they look like cauliflowers.
And then there are nimbus-type clouds, from which precipitation is falling:
Once we determine which of the four main cloud types is applicable, we then estimate the height of the clouds, dividing them into three main layers: low, medium and high.
Low: less than 2 kilometers above the surface, sometimes given the prefix strato
Middle: 2-7 km above the surface, often using the prefix "alto"
High: more than 7 km above the surface, often using the prefix "cirro"
Low clouds are usually made of water droplets, high clouds mainly ice crystals, and the middle clouds can be both.
OK, now you are ready to put it all together. Most cloud names combine a prefix and a suffix, the prefix denoting the height of the cloud and the suffix providing the cloud form.
For example, cirrostratus is a high ice cloud in a layer
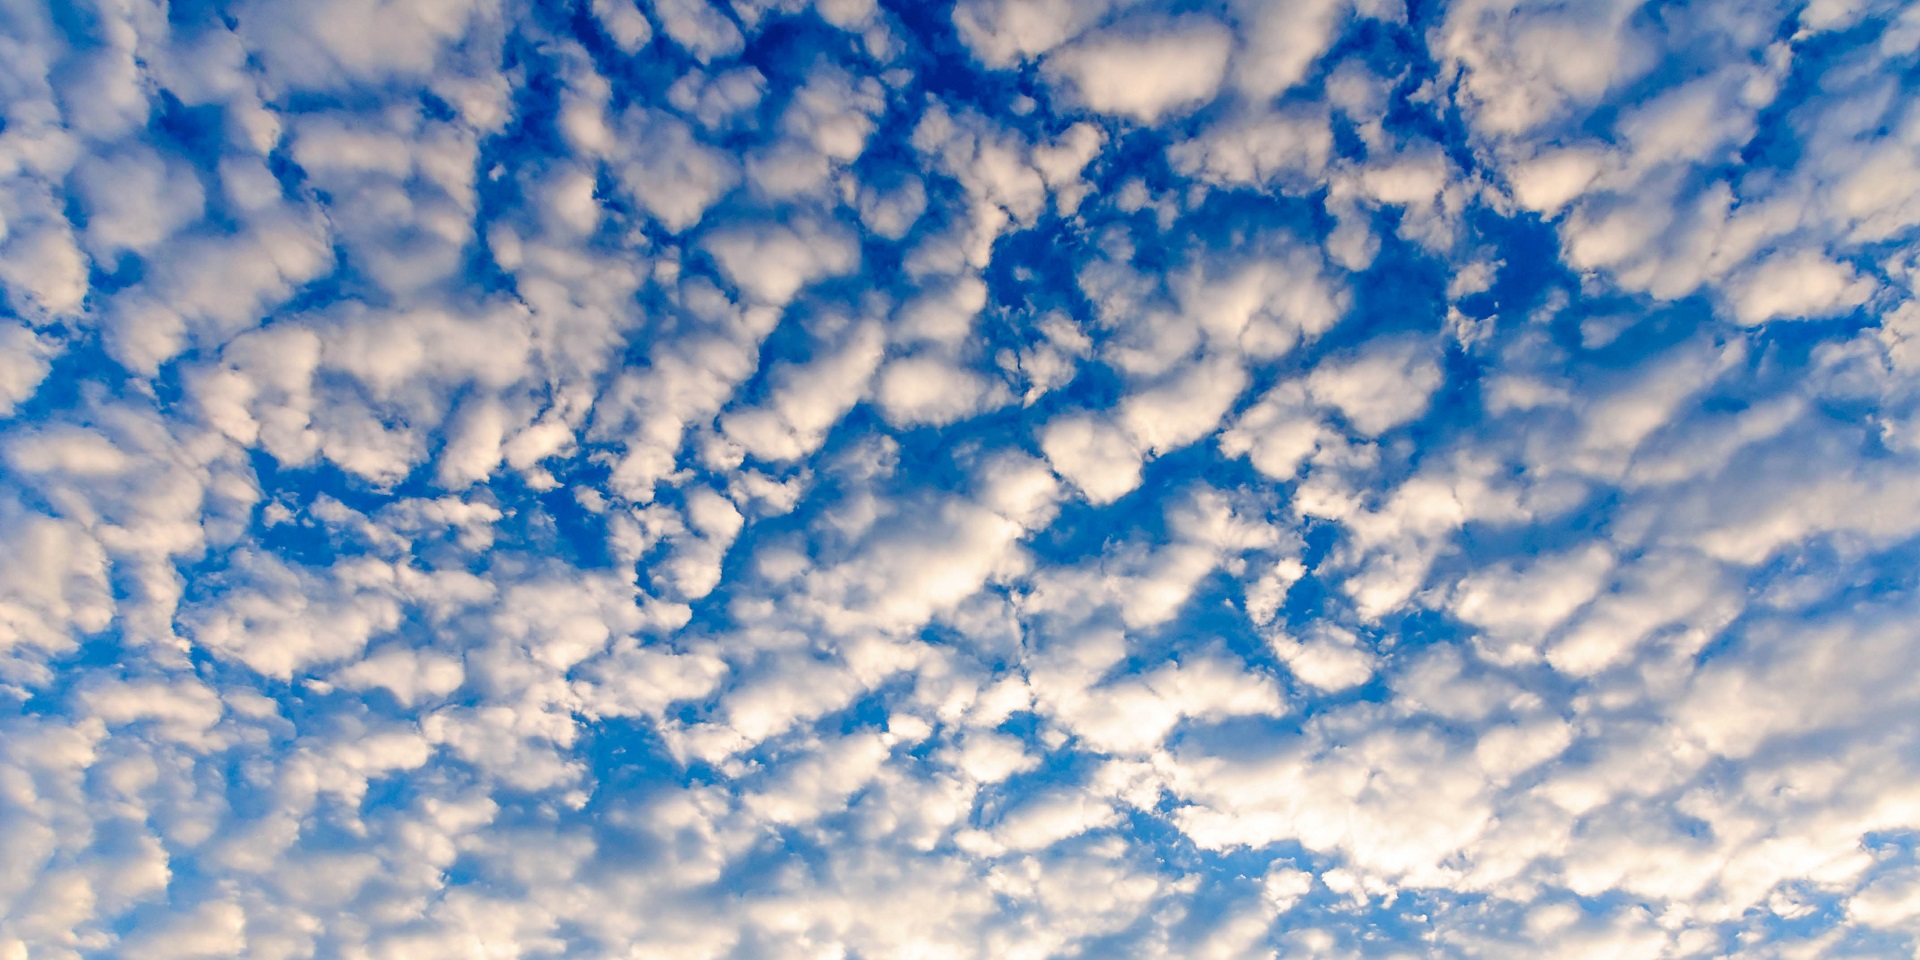
Altocumulusis middle-level cloud that is divided into cumulus-type elements:
And cumulonimbus is a cumulus-type cloud that is precipitating:
Rare Upside Down Lightning Viewed over Puget Sound
On 27th Feb 2021 evening, camera 3 of Greg Johnson's wonderful Skunk Bay weather site captured an extraordinary lightning picture (see below), with the camera looking east over Whidbey Island from its location over the northern Kitsap Peninsula.
What is so amazing and unusual about this lightning?
Look how it starts at a single point at the surface and then fans out into multiple lightning channels as it rises. It looks like something out of the movie Ghostbusters or some science fiction flick!
Most lightning does not look that this.... in fact, 99% of lightning hitting the ground does just the opposite, dividing into multiple branches as it approaches the ground from above...(see below)
.The lightning that hit Whidbey Island around 8 PM on Friday represents "upward-moving" or "ground to cloud" lightning. Such lighting not only has a strong thunderstorm or cumulonimbus cloud above, but generally starts on some kind of high tower, itself often on a hill or higher terrain.
In the picture above (reproduced below) and with the help of Greg Johnson, we determined that the right-most upward lightning bolt came over off a big tower located at the red "plus" symbols. If you look closely, you can see a red light at the top of the tower. We are still working on determining the second tower location to its left.
Inside that strong band, there was intense charge separation in the clouds that led to an increasing potential difference between the surface and the clouds. The surface towers acting as foci for the breakdown of atmospheric resistance to this potential difference, leading to the upward lightning stroke. Upward-moving lightning is rare and having a flowering upward spread like the above is even rarer.
But does happen, with another example being an example of lightning spreading upwards from a transmitter tower in Slovakia:
From Cliff Mass Weather Blog
Weather Knowledge - 27
Observation of the onset of a blue jet into the stratosphere
Blue jets are lightning-like, atmospheric electric discharges of several hundred millisecond duration that fan into cones as they propagate from the top of thunderclouds into the stratosphere1. They are thought to initiate in an electric breakdown between the positively charged upper region of a cloud and a layer of negative charge at the cloud boundary and in the air above. The breakdown forms a leader that transitions into streamers2 when propagating upwards3.
However, the properties of the leader, and the altitude to which it extends above the clouds, are not well characterized4. Blue millisecond flashes in cloud tops5,6 have previously been associated with narrow bipolar events7,8, which are 10- to 30-microsecond pulses in wideband electric field records, accompanied by bursts of intense radiation at 3 to 300 megahertz from discharges with short (inferred) channel lengths (less than one kilometre)9–11.
Here we report spectral measurements from the International Space Station, which offers an unimpeded view of thunderclouds, with 10-microsecond temporal resolution. We observe five intense, approximately 10-microsecond blue flashes from a thunderstorm cell. One flash initiates a pulsating blue jet to the stratopause (the interface between the stratosphere and the ionosphere). The observed flashes were accompanied by ‘elves’12 in the ionosphere. Emissions from lightning leaders in the red spectral band are faint and localized, suggesting that the flashes and the jet are streamer ionization waves, and that the leader elements at their origin are short and localized.
We propose that the microsecond flashes are the optical equivalent of negative narrow bipolar events observed in radio waves. These are known to initiate lightning within the cloud and to the ground, and blue lightning into the stratosphere, as reported here.
Weather Knowledge - 26
The Stratosphere Has Warmed Profoundly This Month. What are the Implications?
Earlier this month, stratospheric temperatures warmed by roughly 100F over a period of a few days, in what is known as a Sudden Stratospheric Warming (SSW). Should you be concerned? The stratosphere, by the way, is the layer of the atmosphere from roughly 10 to 50 km above sea level.
As we will discuss, such stratospheric warmings are sometimes associated with distortions and alterations of the winds and temperatures in the lower atmosphere, resulting in anomalous weather from heat waves to snow storms. And major changes in the infamous polar vortex
There are actually two polar vortices: one high in the stratosphere and another in the troposphere.
The Warming
Early in January, the temperatures high in the polar stratosphere started to warm suddenly and profoundly. Take are look at this NASA plot of temperatures at a pressure at 10 hPa (roughly 85,000 ft above the surface) at the North Pole for this year (red/pink) and last year (blue) by date. The solid black line shows the average temperatures and the gray shading illustrates typical variability of the temperature at that location.
There was quite a warming in early January to about 250 K, roughly 50 K (or Celsius) above normal. That is 90F above normal! Wow.
This is a sudden stratosphere warming, something we typically see once a year in winter. You can view another such warming last winter in March of last year (blue colors).
Importantly, this month’s warming did not last long and is predicted to be gone completely during the next week. Why do such warmings occur? A lot of research has shown they are associated with high amplitude waves in the troposphere that propagate vertically into the stratosphere and disturb the flow there. Waves caused by mountain ranges and land-water contrasts, among other reasons. To understand the potential impacts of the stratosphere warming, let’s go back to the figure at the top of the blog, showing the two polar vortices (shown again below). During a normal winter period, there is an area of very cold air in the upper stratosphere near the North Pole, which is not surprising consider since there is virtually no solar heating! A jet westerly (from the west) jet stream (the polar night jet) surrounds the cold air and in fact creates a protective barrier around it.
In the lower atmosphere (troposphere), there is also cold air near the pole and a westerly jet at its southern boundary: commonly called the jet stream and strongest from roughly 25,000 to 35,000 ft above the surface. The undulations of the jet stream and the associated cold air to the north have a HUGE impact on weather near the surface. For example, a southward undulation can bring a cold wave and snow; a northward undulation, warm temperatures.How stratospheric warming affect surface weather When a polar stratosphere warming occurs, it is associated with strong sinking (which causes warming by compression); the weakening of the temperature difference between a cold pole and warmer air to the south causes the polar night jet to weaken and buckle, and the stratospheric polar vortex circulation weakens and can get distorted or even move off the pole. The effects of the stratosphere polar warming and undulations/distortions of the cold air tends to propagate downward into the troposphere, where the tropospheric polar vortex can weaken and the tropospheric jet stream become wavier. For the event of this month, it was clear that the upper jet stream weakened during the warming. To illustrate, here is the eastward-directed (zonal) winds at 60N for a level near the boundary between the stratosphere and troposphere (150 hPa pressure, about 45,000 ft). The winds (purple) dropped below normal after the warming began early in this month.
But has this stratospheric warming had a major impact on the undulations of the jet stream well down in the troposphere where we are?
To examine this, I plotted the difference from normal of the heights of the 500 hPa pressure surface (roughly 18,000 ft). You can think of this as pressure. And the plots show averages over one week. For the week prior to the warming (Dec. 26- January 1), there are a lot of strong anomalies (difference from normal)…including some anomalous ridging (high pressure over the pole).
The week following the warming (January 10-16th), the polar warming has weakened but perhaps has spread around a bit. Nothing to write home about. One big changing was the ridging (high pressure) over the West Coast and troughing over the eastern US., but hard to point at the warming as the cause. And, in fact, the eastern half of the U.S. has been relatively mild this winter…no severe cold outbreaks. And persistent blocking (locking up of the atmospheric flow) has been relatively absent this winter.
The latest European Center forecast for 500 hPa height anomalies (think of difference from normal of pressure at 18,000 ft), shows higher than normal heights over near the pole and a major trough (low pressure) over the western US. The kind of pattern that occurs more frequently in La Nina years (as this year is).
Weather Knowledge -25
WHAT IS FREEZING RAIN?
Freezing rain is a rare type of liquid precipitation that strikes a cold surface, and freezes almost instantly.
It tends to start its life as snow, ice, sleet or hail, but passes through a layer of air that’s above 0 °C on the way down to the ground, melting into a liquid water droplet.
Freezing rain is more common in other parts of the world, for example in the USA, but is not seen often in the UK.
A fog bow, sometimes called a white rainbow,[1] is a similar phenomenon to a rainbow; however, as its name suggests, it appears as a bow in fog rather than rain.[2]
A faint white or yellowish arc-shaped light that sometimes appears in fog opposite the Sun. A fogbow is similar to a rainbow but forms in a cloud or in fog.
Fogbows are far rarer to witness than rainbows, but they're not entirely unusual either.
The sun had just come up....and this is what I saw--an arch of white light, the fog bow.
And here is another shot. Pretty much all white...and much wider than a normal rainbow.
The fog bow is in the same location as a normal rainbow (opposite of the sun), but why no colors like a normal rainbow?
First, fog droplets--which are really cloud droplets-- are MUCH smaller than the raindrops that produce normal rainbows. Raindrops are typically 2000 microns (millionths of a meter) in size, cloud droplets are about 20 microns in size. To put it another way, raindrops are about 100 times as large as cloud/fog droplets.
So why does size matter?
For a normal rainbow, the sun's light enters the raindrop and reflects off the back. And the light is broken up into various wavelengths of light (different colors) as the light goes between the air and the droplet. The light is bent or refracted at the interface between air and water, with amount of bending dependent on the wavelength of light. This process is called dispersion.
But for a cloud droplet, something else happens at well. The droplet is so small that it is similar to the wavelength of visible light (roughly .5 microns) and the wave-like nature of light is revealed through a process called diffraction. Such diffraction cause the light to be scattered in a range of directions, mixing the colors together. Mixing all colors together gives you white.
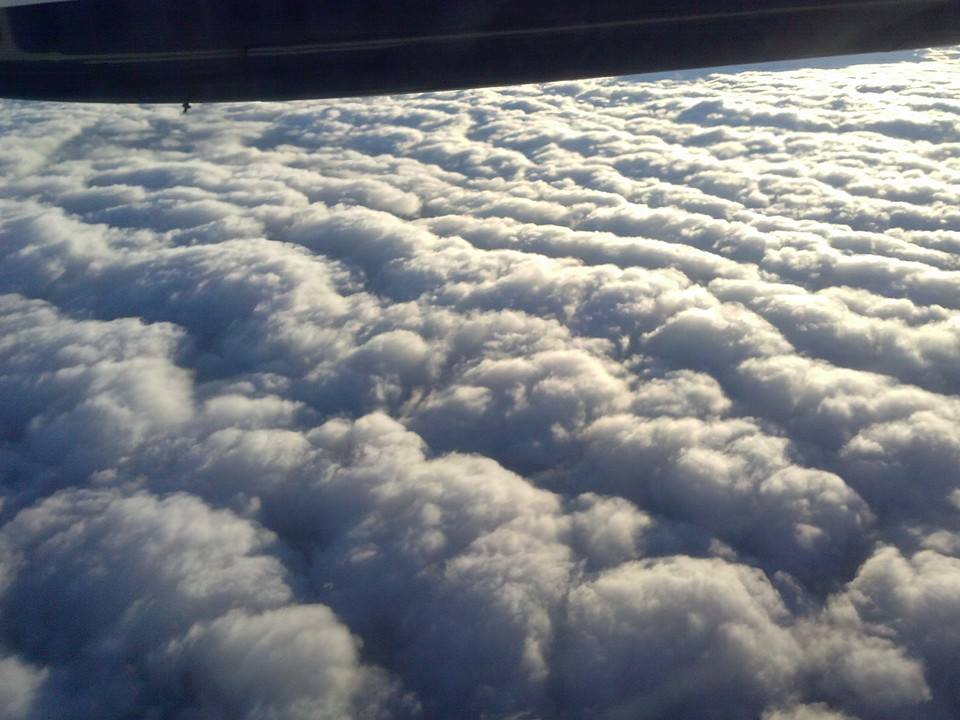
We hear the term “subsidence” is weather every once in awhile. But what is it? To understand that, we have to know that it is usually associated with robust areas, or “domes” of High pressure. Warm moist air that has been lifted high up in the atmosphere by cold fronts and/or central Low pressure(s) eventually blends into High pressure, which is then sent outwards and downwards while cooling and condensing. The effect it has over warmers water below can appear as billowy looking cumulus types and can at times be called “cloud streeting”.
Basically it appears as Altocumulus clouds or can sink to create thicker Startocumulus clouds. Altocumulus:
Stratocumulus: So how would this affect winds?...In the U.S. .. For the east coast, High pressures over the NE US send down moderate to strong NE winds, also known as “the wedge”. Coastal areas with sunshine host a heating element between land and ocean tend to create additional speeds based on the pressure gradient increasing between cool air diving down over water and into land. If this subsidence pushes clouding over the coast, the heating element is thwarted and speeds can fall. Also, this subsidence can get thicker and if it a small area of low pressure or troughing develops, we can get convective cumulus clouding and rain. This tends to shift winds counter-clockwise and drops speeds even further.
Weather Knowledge - 22...30th October 2020
Article on research and study of Arabian Sea Storms done by Vineet Kumar (Vagarian) Reasercher IITM.
Huge explosive volcanic eruptions in the Tropics, energetic enough to push sulphur gases up into the stratosphere where they condense into aerosols, can have a cooling effect on climate by increasing the albedo.
As the stratosphere is very stable and there’ s little movement of material back down into the troposphere, this effect can last a couple of years. The combined eruptions of La Soufrière (1812), Mayon (1814) and Tambora (1815) had catastrophic global effects, leading to a ‘year with no summer’ in 1816. The eruption of Pinatubo in 1992 resulted in a global cooling of up to half a degree for a couple of years. Other recent energetic eruptions include El Chichon (1982) and Agung (1963) which were preceded by half a century of little volcanic activity.
In addition, volcanoes can themselves emit greenhouse gases. The eruption of Eyjafjallajökull in 2010 wasn’t powerful enough to push reflective material into the stratosphere. As the figure below shows, the amount of carbon dioxide the volcano emitted was less than the amount saved by the cancellation of European and trans-Atlantic flights. In addition, fewer flights means fewer contrails, which may have meant there was less high level cloud. What impact this may have on the climate is still being researched.
A more dramatic change in albedo is associated with the ‘snowball Earth’ hypothesis. It’s been suggested that during the Proterozoic (850-630 million years ago), the positive albedo feedback associated with ice accumulation led to ice covering the whole Earth. In this scenario, volcanoes and the huge amounts of greenhouse gases they can emit, would be necessary to warm the Earth again.
The difference between weather and climate is neatly summed up in the saying “the climate is what you expect; the weather is what you get”, frequently attributed to Mark Twain.
Climate is the average weather – for example the mean annual rainfall in Glasgow, the average January temperature in Paris, or how many hurricanes usually happen in the North Atlantic each year. However in any one year, it might be wetter or drier than usual in Glasgow, colder or warmer than usual in Paris or there may be more or less North Atlantic hurricanes, but this won’t necessarily affect the average unless there is a string of years the same.
Usually, the climate is defined as the average weather from the past 30 years
The weather can change from week to week or year to year, whilst the climate remains the same,.


 Once we determine which of the four main cloud types is applicable, we then estimate the height of the clouds, dividing them into three main layers: low, medium and high.


No comments:
Post a Comment