
Weather Knowledge - 10
Derecho
A derecho is a widespread, long-lived, straight-line wind storm that is associated with a fast-moving group of severe thunderstorms known as a mesoscale convective system.
A derecho-producing convective system may remain active for many hours and, occasionally, over multiple days.
A warm-weather phenomenon, derechos occur mostly in summer, especially during June, July, and August in the Northern Hemisphere, within areas of moderately strong instability and moderately strong vertical wind shear. However, derechos may occur at any time of the year, and can occur as frequently at night as during the day.
A common definition is a thunderstorm complex that produces a damaging wind swath of at least 400 km (250 miles), featuring a concentrated area of convectively-induced wind gusts exceeding 30 m/s (90 km/h; 50 kn; 60 mph).
Organized areas of thunderstorm activity reinforce pre-existing frontal zones, and can outrun cold fronts. The resultant mesoscale convective system (MCS) often forms at the point of the strongest divergence of the upper-level flow in the area of greatest low-level inflow and convergence. The convection tends to move east or toward the equator, roughly parallel to low-level thickness lines and usually somewhat to the right of the mean tropospheric flow. When the convection is strongly linear or slightly curved, the MCS is called a squall line, with the strongest winds typically occurring just behind the leading edge of the significant wind shift and pressure rise.
Classic derechos occur with squall lines that contain bow- or spearhead-shaped features as seen by weather radar that are known as bow echoes or spearhead echoes. Squall lines typically "bow out" due to the formation of a mesoscale high pressure system which forms within the stratiform rain area behind the initial convective line. This high pressure area is formed due to strong descending air currents behind the squall line, and could come in the form of a downburst The size of the bow may vary, and the storms associated with the bow may die and redevelop.

-----------------------------------------------------------------------------------------------------------
Weather Knowledge-9
Global Warming Theory in a Nutshell..Roy Spencer Ph.D. Climatologist.
(Updated June 3, 2019)
Every scientific theory involves assumptions. Global warming theory starts with the assumption that the Earth naturally maintains a constant average temperature, which is the result of a balance between (1) the amount of sunlight the Earth absorbs, and (2) the amount of emitted infrared (“IR”) radiation that the Earth continuously emits to outer space.
In other words, energy in equals energy out. This is the same concept that governs the temperature of anything; if energy is gained faster than it is lost, warming occurs… but if energy is lost faster than it is gained, cooling occurs.
Averaged over the whole planet for 1 year, the energy flows in and out of the climate system are estimated to be around 235 to 240 watts per square meter. We don’t really know for sure because our global observations from spaceborne satellite instruments are not accurate enough to measure those flows of radiant energy.
“Greenhouse” components in the atmosphere (mostly water vapor, clouds, carbon dioxide, and methane) exert strong controls over how fast the Earth loses IR energy to outer space. Mankind’s burning of fossil fuels creates more atmospheric carbon dioxide. As we add more CO2, slightly less infrared energy is lost to outer space, strengthening the Earth’s greenhouse effect. This causes a warming tendency in the lower atmosphere and at the surface, and at the same time causes the upper atmosphere (especially the stratosphere) to cool. From an energy standpoint, it’s similar to adding insulation to the walls of a heated house in the winter; for the same rate of energy input (no thermostat), the result will be that the walls are warmer on the inside, and colder on the outside. This is analogous to the greenhouse effect of our atmosphere insulating the Earth’s surface from the “cold” depths of outer space.
It is believed (based upon theoretical calculations) that our global emissions of carbon dioxide have enhanced the Earth’s natural greenhouse effect by about 1%, thus reducing the rate at which IR energy is lost to outer space. Global warming theory (through conservation of energy) says that the lower atmosphere must then respond to this energy imbalance (less IR radiation being lost than solar energy being absorbed) by causing an increase in temperature. This warming then increases the IR escaping to space until the emitted IR radiation once again reaches a balance with absorbed sunlight, and the temperature stops rising. This is the basic explanation of global warming theory.
Manabe and Strickler (1964) calculated the global-average strength of the “greenhouse effect” on surface temperatures assuming all energy transfers were radiative (no weather processes), based upon the theory of how infrared energy courses through the atmosphere. They found that the surface of the Earth would average a whopping 75 deg. C warmer than if there was no greenhouse effect. But in reality, the surface of the Earth averages about 33 deg. C warmer, not 75 deg. C warmer than a no-greenhouse Earth. That’s because convective air currents (which create weather) carry excess heat away from the surface, cooling it well below its full greenhouse effect value represented by their imagined “pure radiative energy equilibrium” assumption.
Now, you might be surprised to learn that the amount of warming directly caused by us adding extra CO2 to the atmosphere is, by itself, relatively weak. It has been calculated theoretically that, if there are no other changes in the climate system, a doubling of the atmospheric CO2 concentration would cause about 1 deg C of surface warming. This is NOT a controversial statement…it is well understood by climate scientists. As of early 2019, we were about 50% of the way toward a doubling of atmospheric CO2.
But everything else in the climate system probably won’t stay the same. For instance, clouds, water vapor, and precipitation systems can all be expected to respond to the warming tendency in some way, which could either amplify or reduce the manmade warming. These other temperature-dependent changes are called “feedbacks,” and the sum of all the feedbacks in the climate system determines what is called ‘climate sensitivity’. Negative feedbacks (low climate sensitivity) would mean that manmade global warming might not even be measurable, lost in the noise of natural climate variability. But if feedbacks are sufficiently positive (high climate sensitivity), then manmade global warming could be catastrophic.
Obviously, knowing the strength of feedbacks in the climate system is critical, and is the subject of much of my research. Here you can read about some of my work on the subject, in which I show that feedbacks previously estimated from satellite observations of natural climate variability have potentially large errors. A confusion between forcing and feedback (loosely speaking, cause and effect) when observing cloud behavior has led to the illusion of a sensitive climate system, when in fact our best satellite observations (when carefully and properly interpreted) suggest an IN-sensitive climate system.
Finally, if the climate system is insensitive, this means that the extra carbon dioxide we pump into the atmosphere is not enough to cause the observed warming over the last 100 years — some natural mechanism must be involved. Here you can read about one candidate: the Pacific Decadal Oscillation, which reflects whether we are in a multi-decadal period of stronger El Ninos (which produce global warmth) or La Nina (which produces global coolness). Other possibilities for natural changes in the climate system also exist.
The most important thing to remember about climate models which are used to project future global warming is that they were “tuned” with the assumption I started this article with: that the climate system is in a natural state of energy balance, and that there is no long-term climate change unless humans cause it.
This is an arbitrary and illogical assumption. The climate system is an example of a “nonlinear dynamical system”, which means it can change all by itself. For example, slow changes in the rate of vertical overturning of the world’s oceans can cause global warming (or global cooling) with no “external forcing” of the climate system whatsoever.
Instead, the climate models are “tuned” to not produce natural climate change. If a 100-year run of the model produces change, the model is adjusted to removed the “drift”. The models do not produce global energy balance from “first physical principles”, because none of the processes controlling that balance are known to sufficient accuracy. Instead, the models are “fudged” to produce energy balance, based upon the modelers’ assumption of no natural climate change. Then, the models are used as “proof” that only increasing CO2 has caused recent warming.
This is circular reasoning.
I am not against modeling; models are necessary to understand complex processes in the climate system. But, while the models are useful and necessary tools for studying climate change, I do not think they can yet be relied upon for major changes in energy policy.
----------------------------------------------------------------------------------------------------------
Weather Knowledge - 8
Friday, June 26, 2020
The Radar Shows Heavy Rain Offshore Without Clouds: How Can That Be?
The radar imagery from the National Weather Service Langley Hill radar near Hoquiam showed heavy showers over the coastal waters last night. To illustrate, here is the radar imagery over the Northwest for 1:14 AM this morning. The reds indicate heavy precipitation! Was it pouring offshore?
A look at the infrared satellite image at the same time shows no weather disturbances out there (see below). Just some clouds to the north (associated with system that will bring us rain on Saturday).
A high resolution visible satellite image taken just before sunset on Thursday confirms the lack of weather offshore. But note the low stratus and fog right along the coast....that will be important later!
So is the expensive Langley Hill radar broken? Is rain falling out of clear skies? Is there an explanation for this mystery?
There is an answer: super bending of the Langley Hill radar beam by an unusually strong and low inversion, where temperature increases with height.
Let us take a look at the vertical sounding of temperature, dew point, and winds with height from the balloon-borne radiosonde released at Forks, on the Washington coast, around 5 AM this morning.
Note how temperature (the right-hand line) increases with height in the lower atmosphere. That represents an inversion. The left line is dew point temperature; when dew point and temperature are the same, the air is saturated, which was true near the surface.
Yesterday afternoon, cool, but shallow, marine air moved into the coast, while warm air remained aloft. The result was a fairly strong inversion in the lower atmosphere. The visible satellite image showing the low clouds on the coast were a hint of what was going on.
So why do we care about inversions? Because they can bend the radar beams (which are in the microwave portion of the electromagnetic spectrum--around 10 cm in wavelength).
A strong inversion can bend the radar beam down to the earth's surface in what is known as superrefraction (see image). The earth's surface (in this case the ocean) is a pretty decent reflector of the radar signal and a good amount propagates back to the radar, giving a false signal of heavy precipitation. That is why the radar showed the arc of supposedly heavy rain offshore. Totally bogus.

Now in the typical atmosphere, with denser air at low levels and less dense air above, there is normally some bending of the radar beam, which is a good thing because it gives the radar greater range (see below)
 From Cliff Mass Weather Blog---------------------------------------------------------------------------------
Weather Knowledge - 7
The radar imagery from the National Weather Service Langley Hill radar near Hoquiam showed heavy showers over the coastal waters last night. To illustrate, here is the radar imagery over the Northwest for 1:14 AM this morning. The reds indicate heavy precipitation! Was it pouring offshore?

A look at the infrared satellite image at the same time shows no weather disturbances out there (see below). Just some clouds to the north (associated with system that will bring us rain on Saturday).

A high resolution visible satellite image taken just before sunset on Thursday confirms the lack of weather offshore. But note the low stratus and fog right along the coast....that will be important later!

So is the expensive Langley Hill radar broken? Is rain falling out of clear skies? Is there an explanation for this mystery?
There is an answer: super bending of the Langley Hill radar beam by an unusually strong and low inversion, where temperature increases with height.
Let us take a look at the vertical sounding of temperature, dew point, and winds with height from the balloon-borne radiosonde released at Forks, on the Washington coast, around 5 AM this morning.
Note how temperature (the right-hand line) increases with height in the lower atmosphere. That represents an inversion. The left line is dew point temperature; when dew point and temperature are the same, the air is saturated, which was true near the surface.

Yesterday afternoon, cool, but shallow, marine air moved into the coast, while warm air remained aloft. The result was a fairly strong inversion in the lower atmosphere. The visible satellite image showing the low clouds on the coast were a hint of what was going on.
So why do we care about inversions? Because they can bend the radar beams (which are in the microwave portion of the electromagnetic spectrum--around 10 cm in wavelength).
A strong inversion can bend the radar beam down to the earth's surface in what is known as superrefraction (see image). The earth's surface (in this case the ocean) is a pretty decent reflector of the radar signal and a good amount propagates back to the radar, giving a false signal of heavy precipitation. That is why the radar showed the arc of supposedly heavy rain offshore. Totally bogus.

Now in the typical atmosphere, with denser air at low levels and less dense air above, there is normally some bending of the radar beam, which is a good thing because it gives the radar greater range (see below)

From Cliff Mass Weather Blog
---------------------------------------------------------------------------------
Weather Knowledge - 7
Weather Knowledge - 7
Saturday, June 20, 2020
Amazing Noctilucent Clouds
One of the most extraordinary and beautiful sights this time of year are the delicate noctilucent clouds that can appear after sunset and before sunrise.
Noctilucent clouds are the highest visible clouds, located around 50 miles above the earth surface.

The first report of noctilucent clouds was in 1885 and a number of studies suggest that such clouds are getting more frequent.
------------------------------------------------------------------------------------
Weather Knowledge - 6Prof. R.R. Kelkar is
The Article below is informative as to why we call it "Cyclone"..taken from Prof. Ranjan Kelkar's Blog "Through Cloud and Sunshine".
One of the most extraordinary and beautiful sights this time of year are the delicate noctilucent clouds that can appear after sunset and before sunrise.
Noctilucent clouds are the highest visible clouds, located around 50 miles above the earth surface.
The first report of noctilucent clouds was in 1885 and a number of studies suggest that such clouds are getting more frequent.
Noctilucent clouds are the highest visible clouds, located around 50 miles above the earth surface.

The first report of noctilucent clouds was in 1885 and a number of studies suggest that such clouds are getting more frequent.
Weather Knowledge - 6
Cyclone, the Coil of a Snake
June 7, 2020
 The word ‘cyclone’ was coined in India in 1840, thirty five years before the India Meteorological Department was established, by a man named Henry Piddington, a seafarer who became a judge who then became a meteorologist. Born in 1797, Piddington served first as a British sea captain, and was later appointed as the President of the Marine Courts of Enquiry at Calcutta (now Kolkata). Presumably, Piddington’s job would have required him to investigate cases of shipwreck and damage to ships caught in storms at sea and to settle claims. However, his interest began to wander far beyond the application of maritime law and he started examining the storms themselves. In December 1789, a storm had struck disaster on the east coast of India, killing over 20,000 people. Piddington made a thorough investigation of this devastating storm and presented his results before the Asiatic Society of Bengal at Calcutta in 1840. In his paper, he described the storm as a ‘cyclone’, a name he had derived from the Greek word ‘kuklos’ meaning going around, or encircling, like the coil of a snake.Piddington thereafter continued with his investigations of storms not only in the Indian seas but around ocean basins all over the world. By 1848, he had done such extensive research that he published a book with this long title: “The Sailor’s Horn-Book for the Law of Storms: Being a Practical Exposition of the Theory of the Law of Storms, and Its Uses to Mariners of All Classes in All Parts of the World, Shewn by Transparent Storm Cards and Useful Lessons”.In the year 1840, when there was no official meteorological agency in India, when so little was known about the atmospheric and oceanic processes, when there were no weather radars and satellites, Piddington could perceive that a cyclone would look like a coil of a snake if seen from the sky above. He explained in his book how he arrived at this new word ‘cyclone’: “I am not altogether averse to new names, but I well know how sailors, and indeed many landsmen, dislike them; I suggest, however, that we might perhaps for all this last class of circular or highly curved winds, adopt the term ‘Cyclone’ from the Greek ‘kuklos’ (which signifies amongst other things the coil of a snake) as neither affirming the circle to be a true one, though the circuit may be complete, yet expressing sufficiently the tendency to circular motion in these meteors. We should by the use of it be able to speak without confounding names which may express either straight or circular winds – such as ‘gale, storm, hurricane,’ &c. – with those which are more frequently used to designate merely their strength. This is what leads to confusion, for we say of, and we the authors ourselves write about, ships and places in the same ‘storm’ having ‘the storm commencing’, ‘the gale increasing’, ‘the hurricane passing over’ and the like; merely because the ships or localities of which we speak had the wind of different degrees of strength, though the whole were experiencing parts of the same circular storm. ‘Cycloidal’ is a known word, but it expresses relation to a defined geometrical curve and one not approaching our usual views, which are those of something nearly, though not perfectly, circular. Now if we used a single word and said ‘the cyclone commenced, increased, passed over, &c.’, we shall get rid of all this ambiguity, and use the same word to express the same thing in all cases; and this without any relation.”We got the first glimpse of a cyclone from outer space in 1960. Since then, we have become very familiar with how a tropical cyclone looks like from space, Television news channels often present animated sequences of the images that clearly show the cloud bands swirling around the centre or the eye of the cyclone, like the coil of a snake. What Piddington could only have imagined, we are actually seeing today.Today, however, tropical cyclones are called by this original name only in India and the adjoining seas, Arabian Sea, Bay of Bengal, and the Indian Ocean. Over the Atlantic Ocean, they are known as hurricanes, and over the Pacific as typhoons.Henry Piddington, the captain-turned-judge-turned-meteorologist, was also engaged in scientific research in varied disciplines like botany, geology, mineralogy and soil chemistry. He published numerous papers in the Journal of the Asiatic Society of Bengal and compiled the ‘English Index to the Plants of India’. He died at Calcutta in 1858.
-------------------------------------------------------------------------------
Weather Knowledge -5June 7th 2020
June 7, 2020
The word ‘cyclone’ was coined in India in 1840, thirty five years before the India Meteorological Department was established, by a man named Henry Piddington, a seafarer who became a judge who then became a meteorologist. Born in 1797, Piddington served first as a British sea captain, and was later appointed as the President of the Marine Courts of Enquiry at Calcutta (now Kolkata). Presumably, Piddington’s job would have required him to investigate cases of shipwreck and damage to ships caught in storms at sea and to settle claims. However, his interest began to wander far beyond the application of maritime law and he started examining the storms themselves.
In December 1789, a storm had struck disaster on the east coast of India, killing over 20,000 people. Piddington made a thorough investigation of this devastating storm and presented his results before the Asiatic Society of Bengal at Calcutta in 1840. In his paper, he described the storm as a ‘cyclone’, a name he had derived from the Greek word ‘kuklos’ meaning going around, or encircling, like the coil of a snake.
Piddington thereafter continued with his investigations of storms not only in the Indian seas but around ocean basins all over the world. By 1848, he had done such extensive research that he published a book with this long title: “The Sailor’s Horn-Book for the Law of Storms: Being a Practical Exposition of the Theory of the Law of Storms, and Its Uses to Mariners of All Classes in All Parts of the World, Shewn by Transparent Storm Cards and Useful Lessons”.
In the year 1840, when there was no official meteorological agency in India, when so little was known about the atmospheric and oceanic processes, when there were no weather radars and satellites, Piddington could perceive that a cyclone would look like a coil of a snake if seen from the sky above. He explained in his book how he arrived at this new word ‘cyclone’:
“I am not altogether averse to new names, but I well know how sailors, and indeed many landsmen, dislike them; I suggest, however, that we might perhaps for all this last class of circular or highly curved winds, adopt the term ‘Cyclone’ from the Greek ‘kuklos’ (which signifies amongst other things the coil of a snake) as neither affirming the circle to be a true one, though the circuit may be complete, yet expressing sufficiently the tendency to circular motion in these meteors. We should by the use of it be able to speak without confounding names which may express either straight or circular winds – such as ‘gale, storm, hurricane,’ &c. – with those which are more frequently used to designate merely their strength. This is what leads to confusion, for we say of, and we the authors ourselves write about, ships and places in the same ‘storm’ having ‘the storm commencing’, ‘the gale increasing’, ‘the hurricane passing over’ and the like; merely because the ships or localities of which we speak had the wind of different degrees of strength, though the whole were experiencing parts of the same circular storm. ‘Cycloidal’ is a known word, but it expresses relation to a defined geometrical curve and one not approaching our usual views, which are those of something nearly, though not perfectly, circular. Now if we used a single word and said ‘the cyclone commenced, increased, passed over, &c.’, we shall get rid of all this ambiguity, and use the same word to express the same thing in all cases; and this without any relation.”
We got the first glimpse of a cyclone from outer space in 1960. Since then, we have become very familiar with how a tropical cyclone looks like from space, Television news channels often present animated sequences of the images that clearly show the cloud bands swirling around the centre or the eye of the cyclone, like the coil of a snake. What Piddington could only have imagined, we are actually seeing today.
Today, however, tropical cyclones are called by this original name only in India and the adjoining seas, Arabian Sea, Bay of Bengal, and the Indian Ocean. Over the Atlantic Ocean, they are known as hurricanes, and over the Pacific as typhoons.
Henry Piddington, the captain-turned-judge-turned-meteorologist, was also engaged in scientific research in varied disciplines like botany, geology, mineralogy and soil chemistry. He published numerous papers in the Journal of the Asiatic Society of Bengal and compiled the ‘English Index to the Plants of India’. He died at Calcutta in 1858.
Weather Knowledge -5
What is the difference between partly sunny and partly cloudy?
Today I was asked about the difference between partly cloudy and partly sunny.


From Cliff Mass Weather Blog


Thursday, May 28, 2020
WEATHER KNOWLEDGE- 4
Wednesday, April 22, 2020
Posted 22nd April 2020: Post Lockdown AQI


In the first few days of the lockdown, it was difficult to observe a change in the pollution signature. “We saw an aerosol decrease in the first week of the shutdown, but that was due to a combination of rain and the lockdown,” said Gupta. Around March 27, heavy rain poured over vast areas of northern India and helped clear the air of aerosols. Aerosol concentrations usually increase again after such heavy precipitation.
“After the rainfall, I was really impressed that aerosol levels didn’t go up and return to normal,” Gupta added. “We saw a gradual decrease, and things have been staying at the level we might expect without anthropogenic emissions.”
The chart above shows daily average aerosol optical depth measurements over northern India from January 1 to April 5, 2020, as compared to the 2016-2019 average. Note that the rise in AOD at the end of February coincided with fire activity in the Indian state of Punjab and in neighboring Pakistan.
According to Gupta, AOD levels in northern India at the beginning of April were significantly below the norm for this time of year and the lowest in 20 years of MODIS observations. Ground observation stations in India have also reported a decrease in particle pollution in the region. Anecdotally, people in the northern state of Punjab have reported seeing the Himalayas for the first time in decades.
In southern India though, the story is a little hazier. Satellite data show aerosol levels have not yet decreased to the same extent; in fact, levels seem to be slightly higher than in the past four years. The reasons are unclear, but could be related to recent weather patterns, agricultural fires, winds, or other factors.
“This a model scientific experiment,” said Levy about the lockdown and its effects on pollution. “We have a unique opportunity to learn how the atmosphere reacts to sharp and sudden reductions in emissions from certain sectors. This can help us separate how natural and human sources of aerosols affect the atmosphere.”

International Boundaries in this map are incorrect
On March 25, 2020, the Indian government placed its 1.3 billion citizens under a strict lockdown to reduce the spread of the COVID-19 coronavirus. The country-wide mandate decreased activity at factories and severely reduced car, bus, truck, and airplane traffic. After just a week of reduced human activities, NASA satellite sensors observed aerosol levels at a 20-year low for this time of year in northern India.
On March 25, 2020, the Indian government placed its 1.3 billion citizens under a strict lockdown to reduce the spread of the COVID-19 coronavirus. The country-wide mandate decreased activity at factories and severely reduced car, bus, truck, and airplane traffic. After just a week of reduced human activities, NASA satellite sensors observed aerosol levels at a 20-year low for this time of year in northern India.
Every year, aerosols from anthropogenic (human-made) sources contribute to unhealthy levels of air pollution in many Indian cities. Aerosols are tiny solid and liquid particles suspended in the air that reduce visibility and can damage the human lungs and heart. Some aerosols have natural sources, such as dust storms, volcanic eruptions, and forest fires. Others come from human activities, such as the burning of fossil fuels and croplands. Human-made aerosols tend to contribute most of the smaller particles that have greater potential for damaging human health.
“We knew we would see changes in atmospheric composition in many places during the lockdown,” said Pawan Gupta, a Universities Space Research Association (USRA) scientist at NASA’s Marshall Space Flight Center. “But I have never seen aerosol values so low in the Indo-Gangetic Plain at this time of year.”
The first five maps above show aerosol optical depth (AOD) measurements over India during the same March 31 to April 5 period for each year from 2016 through 2020. The sixth map (anomaly) shows how AOD in 2020 compared to the average for 2016-2019. Aerosol optical depth is a measure of how light is absorbed or reflected by airborne particles as it travels through the atmosphere. If aerosols are concentrated near the surface, an optical depth of 1 or above indicates very hazy conditions. An optical depth, or thickness, of less than 0.1 over the entire atmospheric vertical column is considered “clean.” The data were retrieved by the Moderate Resolution Imaging Spectroradiometer (MODIS) on NASA’s Terra satellite.
In a typical early spring in the Ganges Valley of northern India, human activities generate the majority of aerosols. Motor vehicles, coal-fired power plants, and other industrial sources around urban areas produce nitrates and sulfates; coal combustion also produces soot and other carbon-rich particles. Rural areas add smoke—rich in black carbon and organic carbon—from cooking and heating stoves and from prescribed burns on farms (though farming fires more often occur at other times of year). By all accounts, the 2020 lockdown reduced those human-made emission sources.
Scientists expect aerosol levels to increase slightly in upcoming weeks in parts of India as seasonal dust storms begin. Dust concentrations are typically low in March and early April, before temperatures rise and strong westerly winds blow sand in from the Thar Desert and Arabian Peninsula. The question is whether overall AOD will remain below normal.
“The hard part with understanding aerosols is that particles can move based on wind patterns and other meteorology,” said Robert Levy, program leader for NASA’s MODIS aerosol products. “You have to disentangle what is caused by the human fingerprint versus a meteorological factor.
NASA Earth Observatory images by Joshua Stevens, using Terra MODIS analysis courtesy of Pawan Gupta/USRA/NASA. Story by Kasha Patel with image interpretation from Hiren Jethva, Rob Levy, and Ralph Kahn.
Saturday, April 18, 2020
Weather Knowledge - 2:


(From Weather flow)

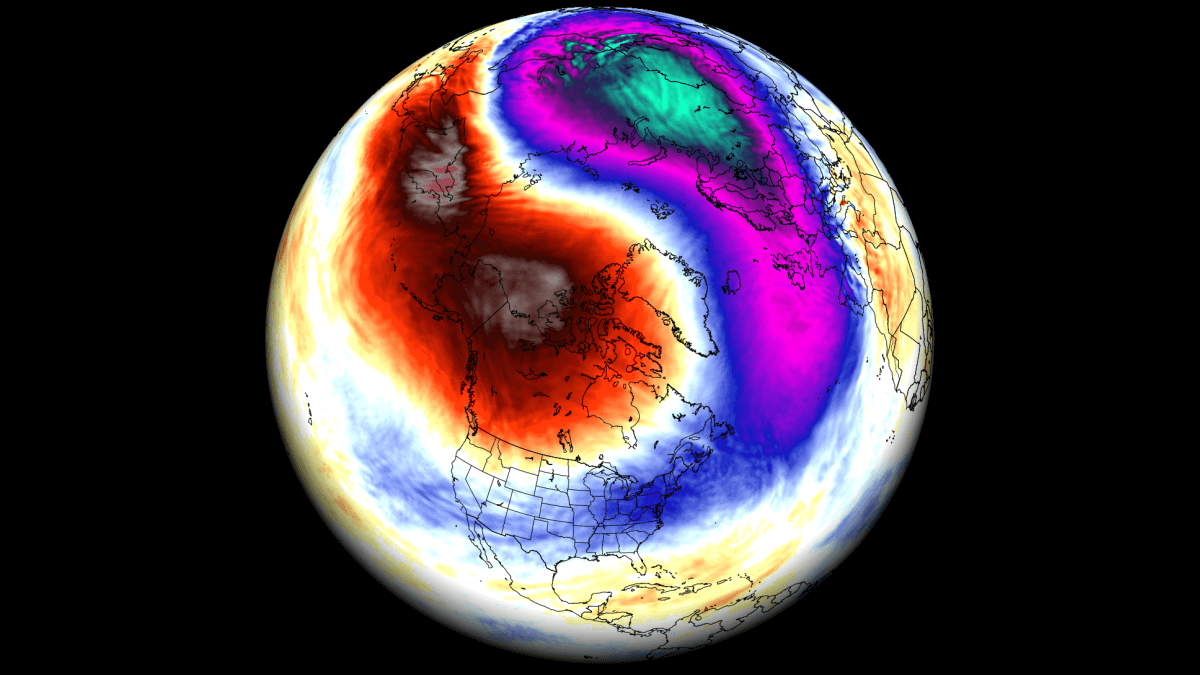
Notice how this wind circulation is largely cut off from the overall flow of upper-level wind circulating from W. to E. around the world.
Once such an air mass is cut off from the overall circulation it tends to linger in place for several days until it is again caught up in the upper-level wind pattern. Hence the term Cut-Off Low for this type of airmass.
Often a Cut-Off Low will induce a counter-clockwise spinning surface low at the surface.
You can see this happening in the second image. Due to the presence of Northern California and the coast range, the low pressure looks more like an elongated eddy running parallel to the coast.

Tuesday, April 07, 2020
Weather Knowledge - 1
Virga is rain that doesn’t reach the ground
We’ve all seen virga, but maybe not known what it’s called. Virga is rain that evaporates before it hits the ground.
It’s an especially dramatic sight at sunrise or sunset.
The photos on this page are from EarthSky friends.
 Pic By Mike Lewinsky
Venus and waning crescent moon at dawn on June 1, 2019 over the Sangre de Cristo mountains near Taos. There is virga near the horizon, extending downward from the clouds.
Was this cloud trying to rain itself out? No rain in sight,


No comments:
Post a Comment