Weather Knowledge - 60
July 30, 2025
Pyrocumulus Over the Olympic Peninsua
The wildfire creates a large cumulus or cumulonimbus cloud, we call it a pyrocumulus.

Yesterday, a large pyrocumulus cloud formed over the southwest side of the Olympics, associated with the 2000-acre Bear Gulch fire (see map below).


Weather Knowledge- 59
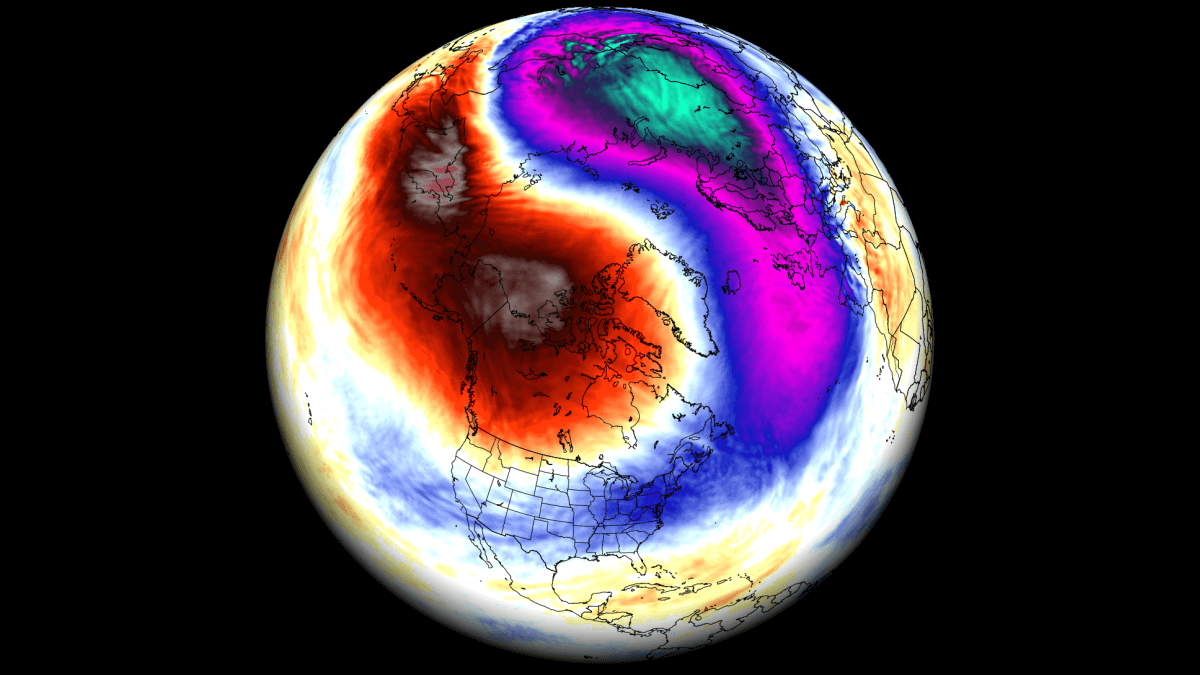
The Northern Magnetic Pole's Shift Over 400 Years:
Earth's magnetic poles are undergoing dramatic change — and the pace of change is accelerating.
The North Magnetic Pole, the point where Earth's geomagnetic field is vertical, has been steadily shifting for centuries. A historical mapping of its movement from 1640 to 2020 reveals a gradual northwest trajectory in more recent centuries, primarily toward Siberia.
This shift has significantly accelerated in the past century, with the pole rapidly approaching Russia.
The movement is influenced by changes in the dynamics of Earth's molten iron core, which generates the planet's magnetic field. Unlike fixed geographical poles, the North Magnetic Pole's position fluctuates daily within an oval-shaped locus due to geomagnetic variations.
To create maps like these, scientists use historical data from magnetic measurements taken at various locations over centuries, including records from old compass readings, volcanic rock samples, and recent satellite observations.
Image: Nature

The shift of the North Magnetic Pole doesn't directly affect climate. It's primarily related to navigation and Earth's magnetic field, which is generated by the planet's molten iron core. Climate is influenced by various factors, including atmospheric conditions, ocean currents, and solar radiation. While changes in Earth's magnetic field can affect charged particles from the sun interacting with the atmosphere, which might have minor effects on atmospheric circulation, the magnetic pole shift itself isn't a direct driver of climate change.
------------
Weather Knowledge_58
CROSSWINDS IN THE MESOSPHERE: On July 10th, photographer Peter Rosén of Stockholm, Sweden, captured an extraordinary time-lapse video of noctilucent clouds (NLCs) rippling across the northern sky. At first glance, the scene is familiar—silvery tendrils flowing like smoke above the horizon. But take a closer look:
There are two distinct layers of clouds moving in different directions, stacked one atop the other.
"This is new to me," says Rosén, who has been watching NLCs over Sweden for the past 20 years. "There are two layers moving in opposite directions, but also interfering and creating interesting patterns."
Noctilucent clouds form when summertime plumes of water vapor rise to the mesosphere (83 km high) and frost the ashes of disintegrated meteors. The layer where these clouds form is extremely thin—typically less than 10 km from bottom to top. Yet somehow, two dynamic layers of clouds have squeezed into this narrow wafer of air.
"This is a very cool time-lapse video!" says Cora Randall, a Distinguished Professor Emerita and leading expert in NLC physics at the University of Colorado. "Using radar, Chinese researchers have recently found strong vertical wind shears in the mesosphere--probably linked to gravity wave activity." Rosén may have captured these exact phenomena in visual form.
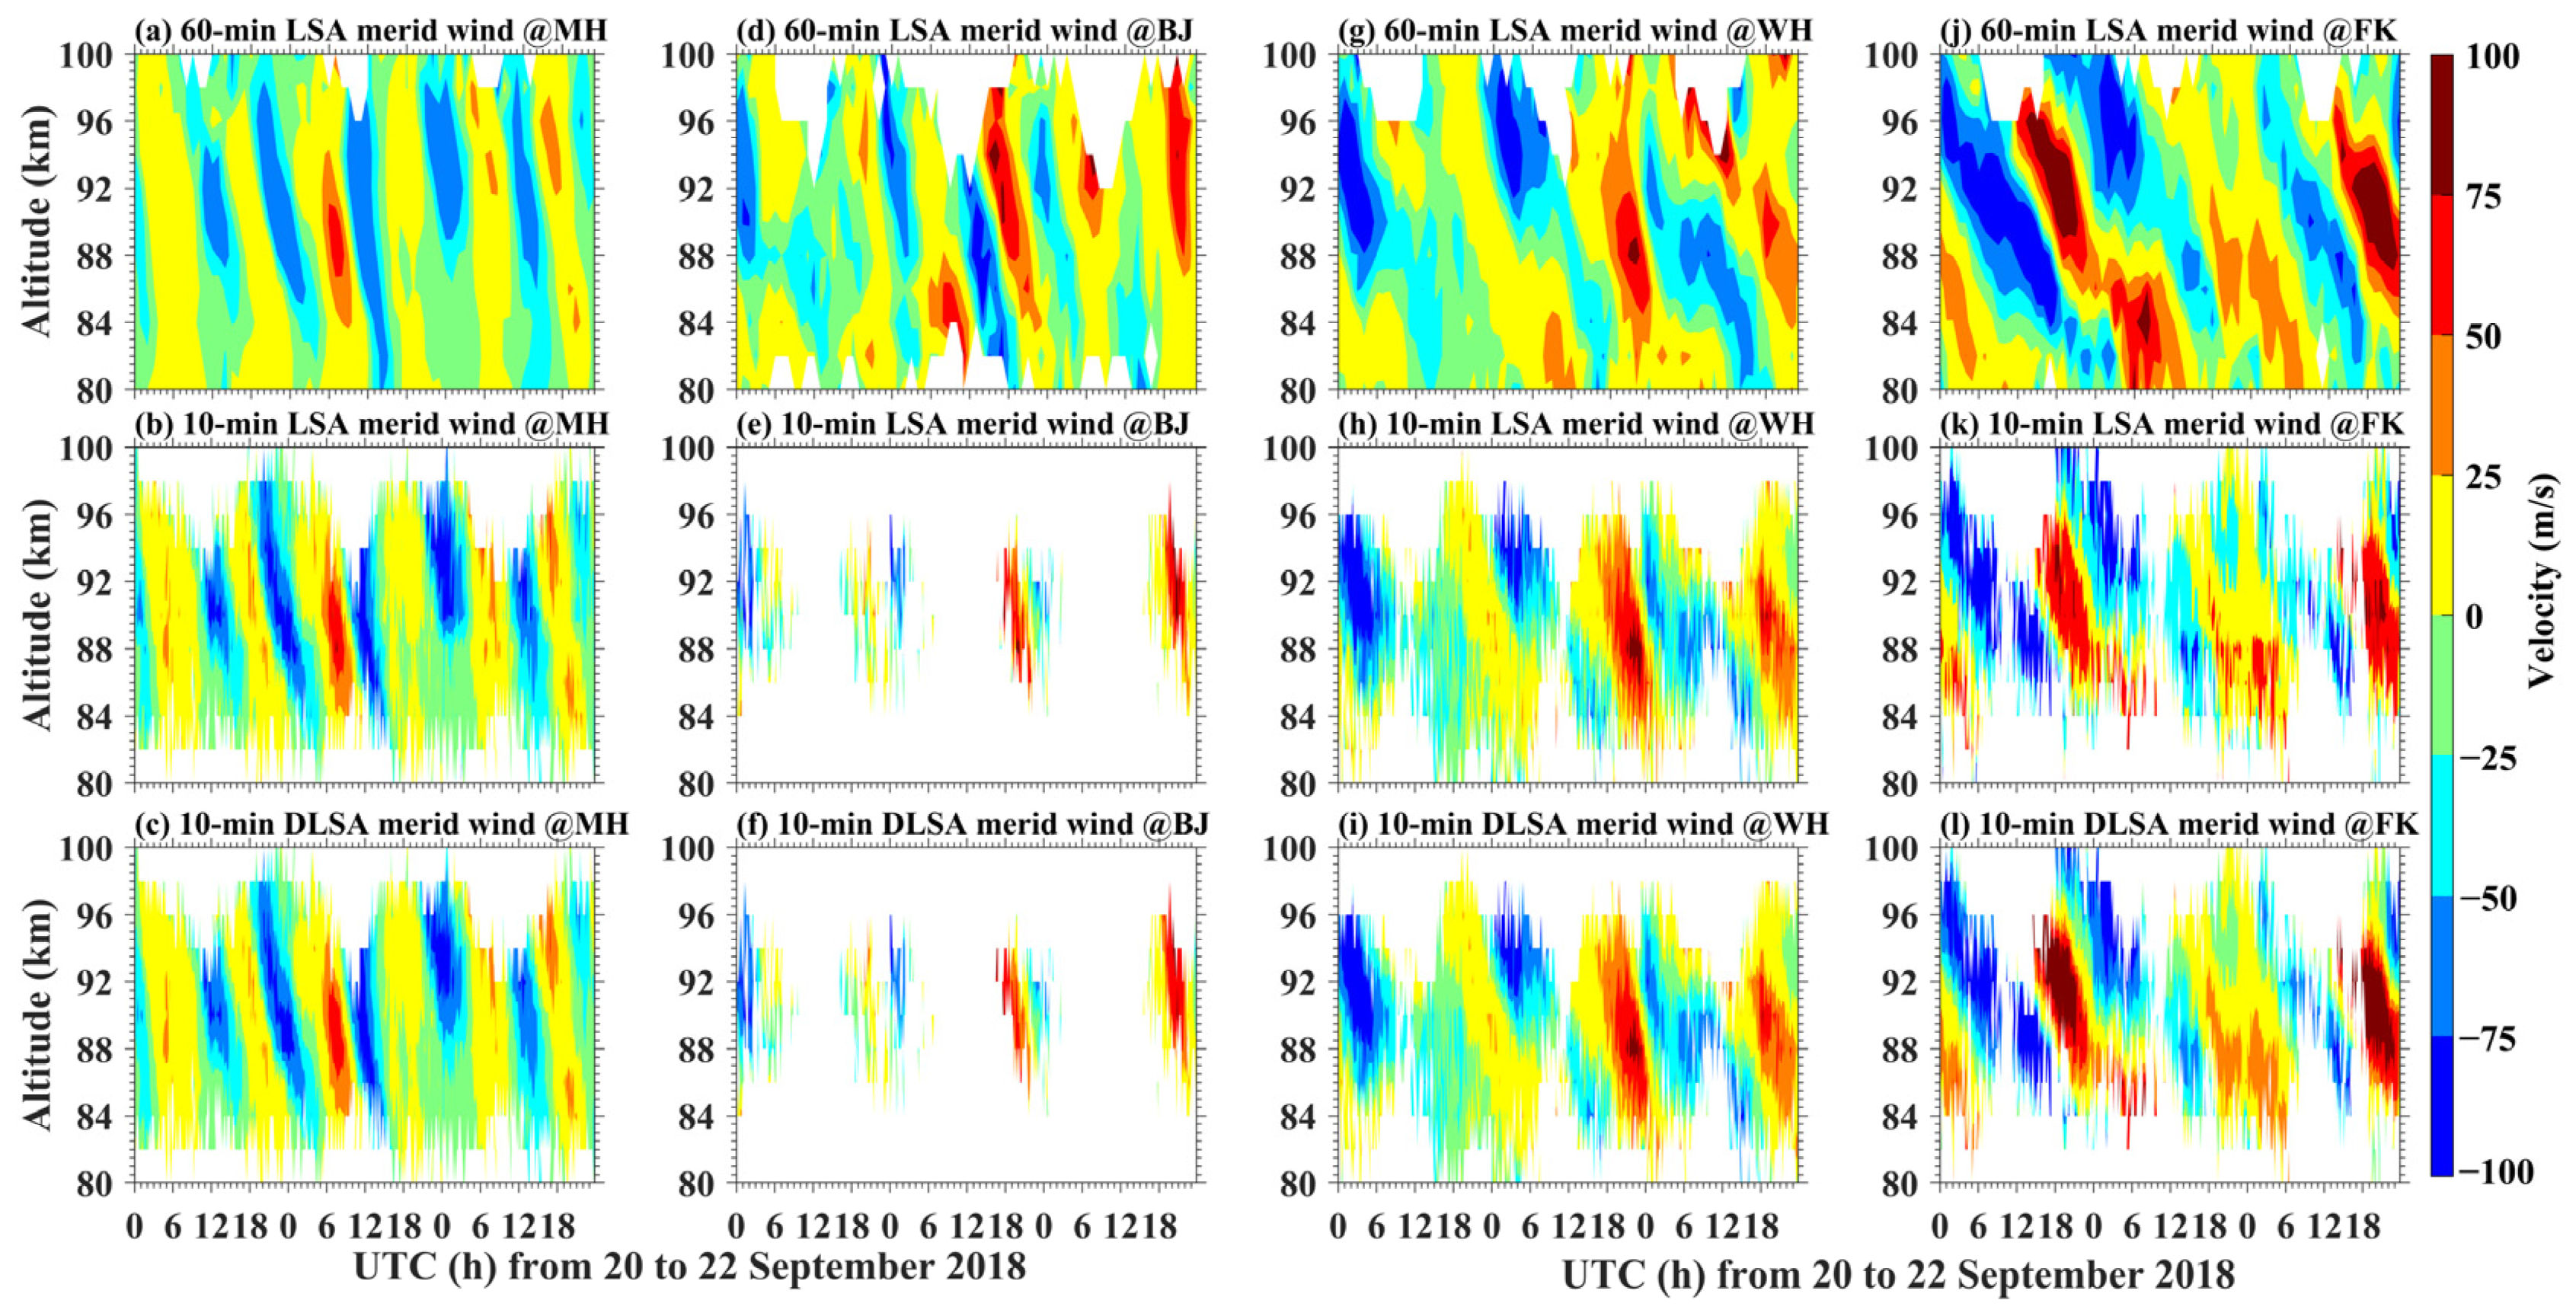
Above: Maps of vertical wind shear in the noctilucent zone captured by Chinese radar (ref)
"We know that vertical wind shears can be large at NLC altitudes - so this isn't completely surprising," adds Lynn Harvey of the Laboratory for Atmospheric and Space Physics (LASP) in Boulder, CO. "But is this the first time it's been so clearly documented?"
It seems so. Rosén’s camera captured crosswinds in the mesosphere--a rare visual confirmation of complex dynamics near the edge of space.
Weather Knowledge - 57
Clouds Hover Over the Alaska Peninsula
April 7, 2025
The VIIRS (Visible Infrared Imaging Radiometer Suite) on the NOAA-21, Suomi NPP, and NOAA-20 satellites captured this series of images between 2:40 and 3:30 p.m. local time (22:40 and 23:30 Universal Time) on April 7. The animation help illustrates how these “topographically anchored” clouds stayed relatively stable and stationary, said Scott Lindstrom, a remote sensing expert at the University of Wisconsin-Madison’s Space Science and Engineering Center. Lindstrom was alerted to these clouds by staff at the National Weather Service Forecast Office in Juneau, Alaska.
Wave clouds form when prevailing winds encounter a topographic barrier, such as a mountain range. The air is forced to flow up and over the mountains, causing it to cool and any water vapor it contains to condense, forming clouds. The clouds may appear to hover in the sky even though wind is racing through them.
Atmospheric sounding data and ground observations collected that day showed strong, low-level winds blowing over the Bering Sea from the north, Lindstrom wrote in a blog post detailing the phenomenon. Around the time of the images, measurements also revealed a stable inversion layer from approximately 1,000 to 2,000 meters in altitude, above most of the peaks on the peninsula. As a result, he said, the conditions were right for standing wave clouds to form downwind of the ridge crests.
Weather Knowledge - 56
Why do Atmospheric Rivers Occur?
A significant atmospheric river event will occur tomorrow (Sunday) and Monday, with heavy precipitation in the mountains and South Sound.
The latest UW WRF model forecast predicts up to 10 inches in the Cascades, with the southern WA Cascades being hit the hardest (see below). In contrast, a profound rain shadow will extend from the NE Olympics to Bellingham.


Atmospheric rivers in our region are associated with plumes of warm, moist air from the south, southwest, and west.
NOAA weather satellites can sense the water vapor, which is very evident in the water vapor image from this morning (below). A massive plume of water vapor is moving our way.

Numerical weather prediction models, like the UW WRF model, can skillfully forecast such water vapor plumes, which release massive amounts of water as the air is forced to rise by our region's substantial terrain.
Meteorologists favorite diagnostic for atmospheric rivers is integrated water vapor transport (IVT), which is the amount of water vapor times the wind speed, summed up in the vertical (that is where the integrated comes from). This quantity is more closely related to the potential for regional rainfall.
The prediction of IVT for Sunday morning is shown below, with the arrows showing both the direction and magnitude of the moisture transport Large values, but not record-breaking by any means.
Such moisture plumes are generally warm as well. In fact, to get large values they HAVE to be warm since the amount of moisture air can hold depends on temperature (warm air can potentially hold more water vapor than cold air).

Atmospheric rivers form in our region when strong southwesterly atmospheric wind currents occur, currents that move large values of water vapor out of the subtropics.

The interesting thing about atmospheric rivers is that they are like regular rivers in another way...not only does water come into the river at the beginning, but there is a convergence of water vapor from the sides along the way, not unlike the small streams that drain into a river over its entire path.

Weather Knowledge - 55

Weather Knowledge - 54
'Frost Flowers' And 5 Other Interesting Phenomena Our Meteorologists Watch For In Winter
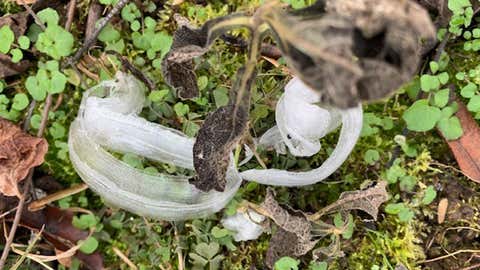
1. Frost Flowers
Frost flowers are fairly rare to see, but conditions over the Thanksgiving 2024 holiday near Ridgetop, Tennessee, allowed Morning Brief newsletter reader Leslie R. Ratliff to pass along the great example below.
They develop where there is moist, unfrozen soil during below-freezing temperatures (32 degrees or lower).
Water pulled up from the soil into a plant's stem freezes, expands and splits the stem. As more water is drawn up through the stem split, more freezing occurs, eventually forming a fragile petal of the frost flower.
These amazing formations often melt or sublimate (transition from ice to water vapor) quickly after sunrise.
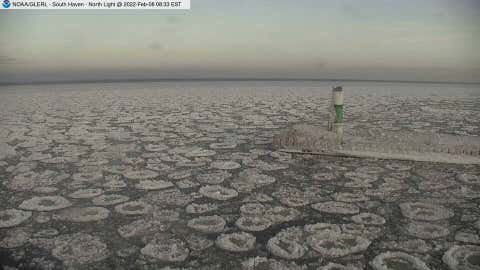
2. Pancake Ice
Resembling frozen lily pads, pancake ice forms when there is some wave action on a body of water and temperatures are just below freezing.
Pancake ice can begin as a thin ice layer (known as grease ice) or slush on the water surface, which accumulates into quasi-circular disks. The "lily pad," or raised-edge appearance of pancake ice, can form when each disk bumps up against one another, or when slush splashes onto and then freezes on the slab's edge.
The floating disks of ice can be up to 10 feet in diameter and four inches thick.
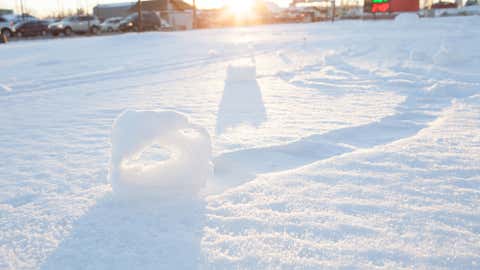
3. Snow Rollers
This winter phenomenon occurs when strong winds pick up moist snow and blow it along the ground, eventually building a cylinder of snow that is often hollow in the middle. When the snow roller grows too large for the wind to propel it farther, it stops
Here are the optimal conditions for snow roller generation, according to the National Weather Service:
- Existing icy or crusty snow cover, so additional snow will not stick to it.
- Additional wet, loose snow on top of the icy, crusty snow cover.
- Wind strong enough to scoop out balls of snow and propel snow roller forward.
- At least some slope to the ground.
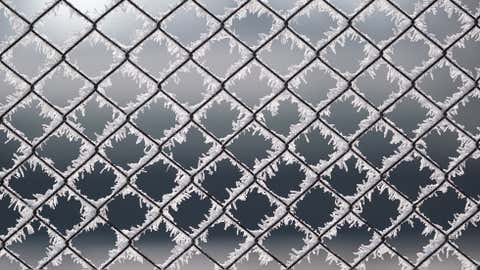
4. Hoarfrost
Frost is not an uncommon sight during the cold months of the year, but hoarfrost is in a league of its own.
One or more days in a row of freezing fog (fog with air temperatures of 32 degrees or colder) is a perfect scenario for the formation of hoarfrost. This is because there is more moisture in the air compared to a day that might produce a typical frost.
With the extra moisture in the air, the interlocking crystal patterns of frost become more intricate and much larger, building up to a greater depth on tree branches, signs and fences, as seen below.
5. Boiling Water Freezing In The Air
An experiment we see sometimes during frigid arctic air outbreaks is tossing boiling water into the air.
Once airborne, the boiling water changes state into steam/ice as it enters the cold, dry air mass, which is based on the Mpemba effect.
It works best when the air is very dry in subzero temperatures.
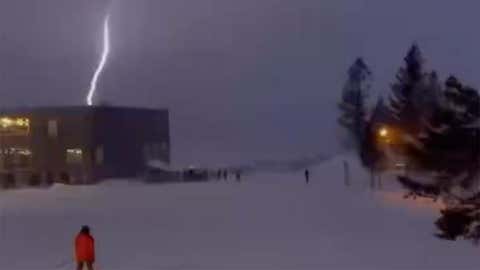
6. Thundersnow
For many meteorologists and weather enthusiasts, hearing the crack of thunder during a snowstorm triggers excitement.
When thundersnow occurs, snowfall rates tend to be very heavy, many times reaching an inch or more per hour.
A pocket of unstable air aloft is needed to generate this weather phenomenon.
Typically, these pockets of instability develop as upward bumps on top of the flat layer of snow clouds already in place. This development occurs in response to strong lifting from an upper-level disturbance in the atmosphere.
If temperatures are between 14 degrees and -4 degrees Fahrenheit inside the upward bump where the elevated pocket of unstable air resides, snowflakes and small hailstones can form. As the snowflakes and hail collide, electrical charges will build up, making lightning and thunder possible.
Most often, the lightning flash associated with thundersnow illuminates the cloud cover with no distinct bolt visible. However, on rare occasions we see cloud-to-ground strikes like this one from Idaho in March 2024.
Chris Dolce has been a senior meteorologist with weather.com for over 10 years after beginning his career with The Weather Channel in the early 2000s.
Weather Knowledge -53
3rd September 2024-
Relationship between CO2 and Global Temperature: