Weather Knowledge - 19
Foehn effect
The foehn effect causes warming and drying of air on the lee side of cross mountain wind.
What is the foehn effect?In simple terms, this is a change from wet and cold conditions one side of a mountain, to warmer and drier conditions on the other (leeward) side.
Foehn winds (sometimes written "Föhn") are common in mountainous regions, regularly impacting the lives of their residents and influencing weather conditions for hundreds of kilometres downwind. Their notoriety has led to recognition by a multitude of names including: the Chinook or "snow eater" of the North American Rocky Mountains; the Zonda of the South American Andes; and the Helm wind of the English Pennines.
On 14 - 15 January 1972 in Montana, USA, a foehn chinook event was responsible for the greatest temperature change over a 24 hour period ever recorded in the United States: according to the US National Weather Service the temperature rose a staggering 57 °C; from -48 to 9 °C.
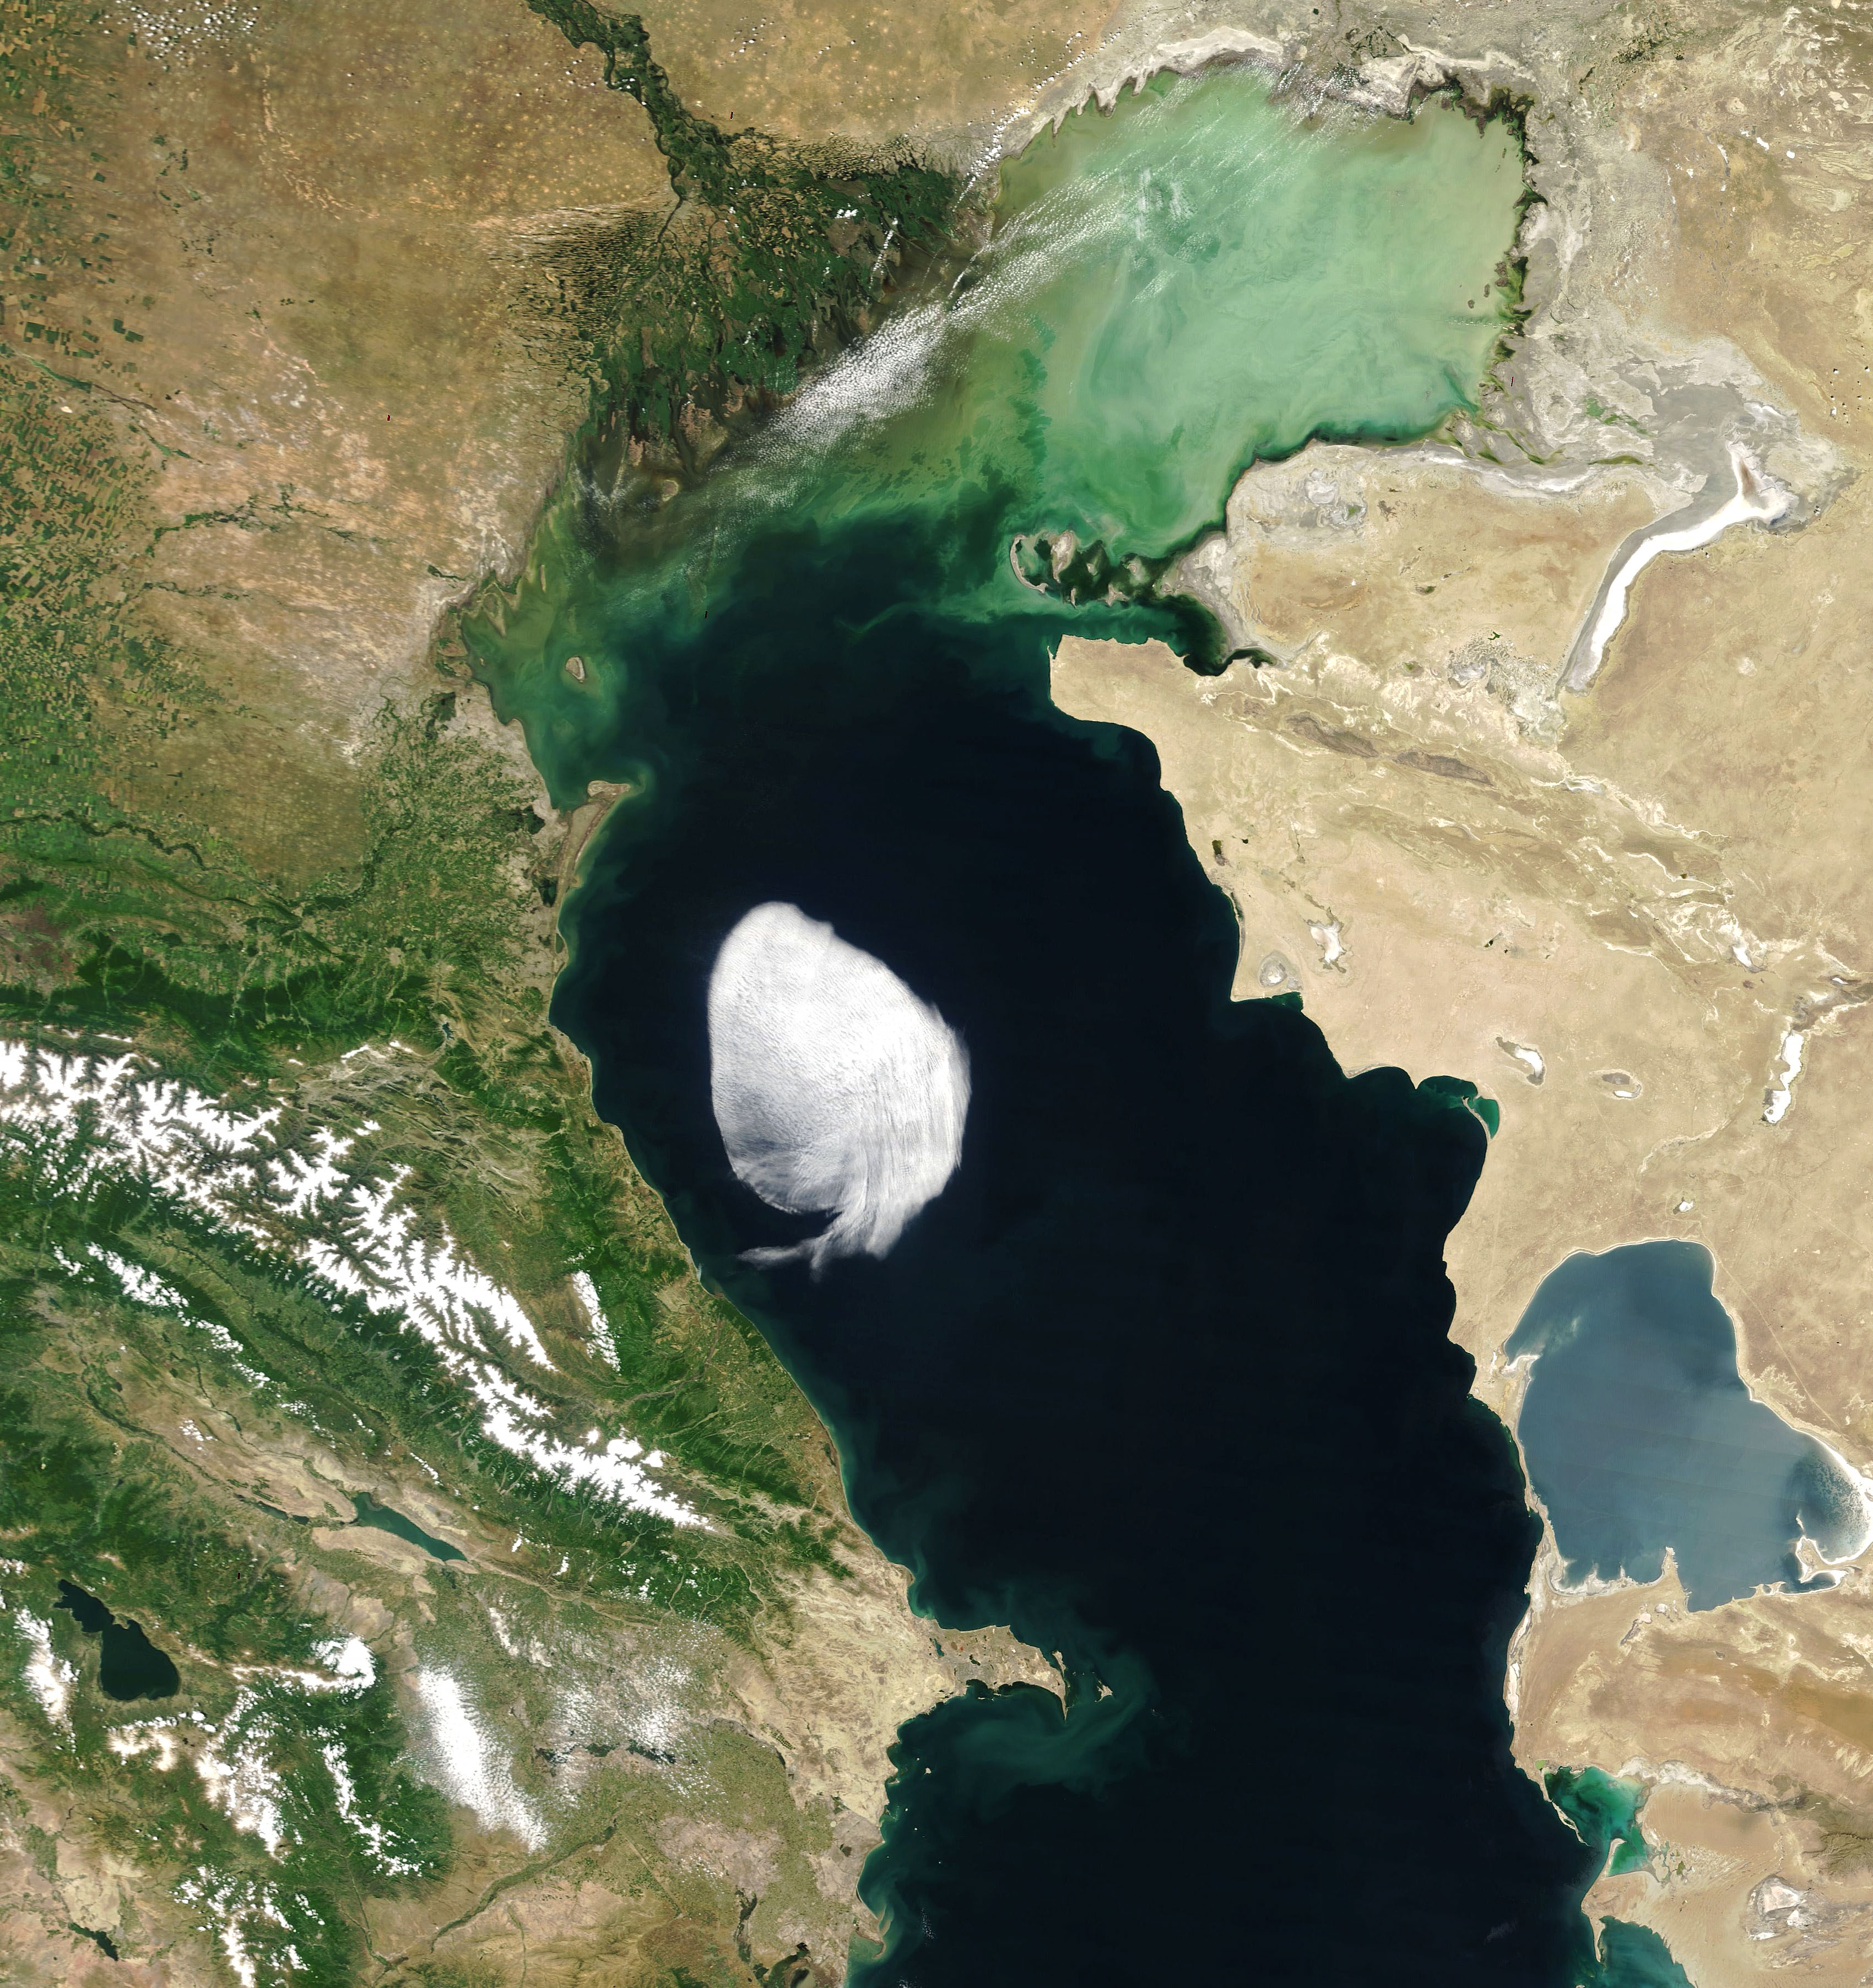
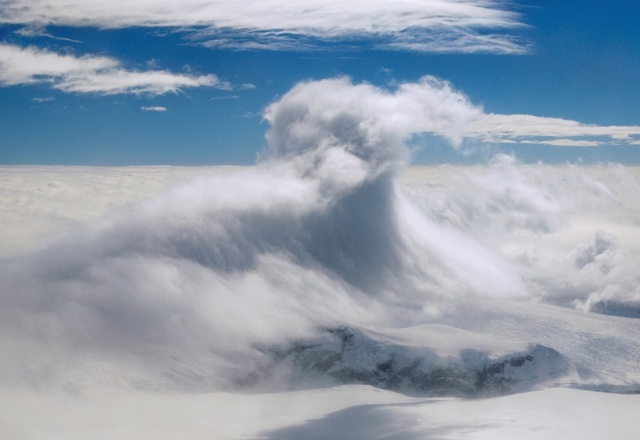
Foehn events are often accompanied by dramatic cloud formations above the mountains, such as towering lenticular clouds and lower-level rotor clouds. This is seen in the photo below revealing overturning and turbulence during a foehn event over the Antarctic Peninsula.

Foehn winds (sometimes written "Föhn") are common in mountainous regions, regularly impacting the lives of their residents and influencing weather conditions for hundreds of kilometres downwind. Their notoriety has led to recognition by a multitude of names including: the Chinook or "snow eater" of the North American Rocky Mountains; the Zonda of the South American Andes; and the Helm wind of the English Pennines.
On 14 - 15 January 1972 in Montana, USA, a foehn chinook event was responsible for the greatest temperature change over a 24 hour period ever recorded in the United States: according to the US National Weather Service the temperature rose a staggering 57 °C; from -48 to 9 °C.
Foehn events are often accompanied by dramatic cloud formations above the mountains, such as towering lenticular clouds and lower-level rotor clouds. This is seen in the photo below revealing overturning and turbulence during a foehn event over the Antarctic Peninsula.

How does the foehn effect work?
Explanations of the foehn effect in popular literature or on the web often single out just one causal mechanism (#1 in the below), but there are in fact four known causes. These mechanisms often act together, with their contributions varying depending on the size and shape of the mountain barrier and on the meteorological conditions, for example, the upstream wind speed, temperature and humidity.
There are four mechanisms which combine to create the foehn effect:
1) Condensation and precipitation
When air is forced upwards over elevated terrain, it expands and cools due to the decrease in pressure with height. Since colder air can hold less water vapour, moisture condenses to form clouds and precipitates as rain or snow above the mountain's upwind slopes. The change of state from vapour to liquid water is accompanied by heating, and the subsequent removal of moisture as precipitation renders this heat gain irreversible, leading to the warm, dry foehn conditions in the mountain's lee. This mechanism has become a popular textbook example of atmospheric thermodynamics and it lends itself to attractive diagrams. However, the common occurrence of 'dry' foehn events, where there is no precipitation, implies there must be other mechanisms.
When air is forced upwards over elevated terrain, it expands and cools due to the decrease in pressure with height. Since colder air can hold less water vapour, moisture condenses to form clouds and precipitates as rain or snow above the mountain's upwind slopes. The change of state from vapour to liquid water is accompanied by heating, and the subsequent removal of moisture as precipitation renders this heat gain irreversible, leading to the warm, dry foehn conditions in the mountain's lee. This mechanism has become a popular textbook example of atmospheric thermodynamics and it lends itself to attractive diagrams. However, the common occurrence of 'dry' foehn events, where there is no precipitation, implies there must be other mechanisms.
2) The draw-down of air from aloft
When the approaching winds are insufficiently strong to propel the low-level air up and over the mountain barrier, the air is said to be 'blocked' by the mountain and only air higher up near mountain-top level is able to pass over and down the lee slopes as foehn winds. These higher source regions provide foehn air that becomes warmer and drier on the leeside after it is compressed with descent due to the increase in pressure towards the surface.
When the approaching winds are insufficiently strong to propel the low-level air up and over the mountain barrier, the air is said to be 'blocked' by the mountain and only air higher up near mountain-top level is able to pass over and down the lee slopes as foehn winds. These higher source regions provide foehn air that becomes warmer and drier on the leeside after it is compressed with descent due to the increase in pressure towards the surface.
3) Turbulent mixing
When river water passes over rocks, turbulence is generated in the form of rapids, and white water reveals the turbulent mixing of the water with the air above. Similarly, as air passes over mountains, turbulence occurs and the atmosphere is mixed in the vertical. This mixing generally leads to a downward warming and upward moistening of the cross-mountain airflow, and consequently to warmer, drier foehn winds in the valleys downwind.
When river water passes over rocks, turbulence is generated in the form of rapids, and white water reveals the turbulent mixing of the water with the air above. Similarly, as air passes over mountains, turbulence occurs and the atmosphere is mixed in the vertical. This mixing generally leads to a downward warming and upward moistening of the cross-mountain airflow, and consequently to warmer, drier foehn winds in the valleys downwind.
4) Radiative warming
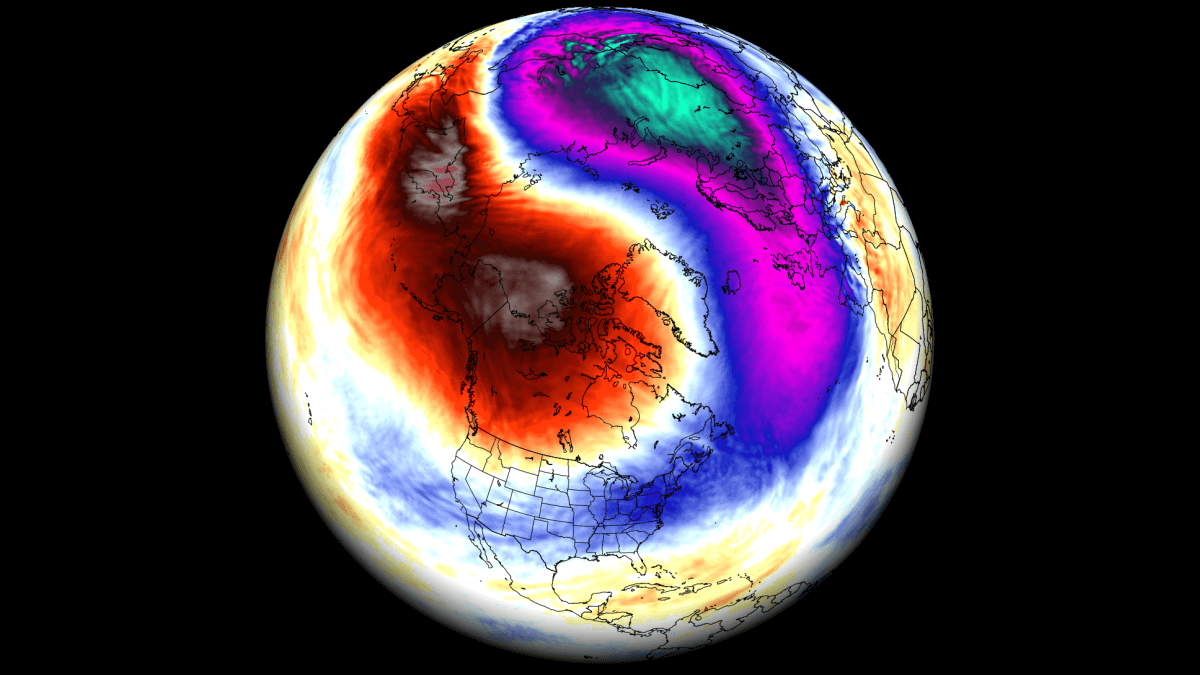
Dry foehn conditions are responsible for the occurrence of rain shadows in the lee of mountains, where clear, sunny conditions prevail. This often leads to greater daytime radiative (solar) warming under foehn conditions. This type of warming is particularly important in cold regions where snow or ice melt is a concern and/or avalanches are a risk.
Weather knowledge - 18
• Warm ocean temperatures, greater than 26°C to a depth of at least 60m. Tropical cyclones only form over oceans, never over land, as they need sources of both heat and moisture. Even if the surface waters are very warm, the strong winds in a developing cyclone cause mixing of the surface layer of the ocean, bringing water up from below the surface. If this water is very much cooler than the surface, the supply of heat to the system will be reduced.
• Latitudes greater than 5° north or south of the equator. Cyclones are rotating systems and so only form in regions with a sufficient component of the Earth’s rotation about the local vertical (the Coriolis Effect) . This is zero on the equator itself and only becomes large enough to generate rotation within a weather system poleward of 5° of latitude.
• No large changes in wind speed and direction with height (known in meteorological terms as low wind shear). Cyclones rely on the development of tall columns of convective cloud which extend of the order of 10 km in the vertical. If the wind is changing too much with height, these columns of cloud cannot form through a great enough depth of the atmosphere as the tops will be constantly blown away.
• Lots of moisture through the depth of the atmosphere. As well as large wind shear, a dry atmosphere can also act to prevent deep columns of cloud forming.
• A pre-existing disturbance in the atmosphere. Tropical cyclones do not form spontaneously from nothing. There needs to be an area of enhanced thunderstorm activity which can act as a focus for the development of the cyclone in the presence of all the other conditions listed above. Forecasting the formation of tropical cyclones relies on early identification of these pre-existing disturbances and then recognising which ones will amplify into full-blown cyclones.
The development of tropical cyclones is a complex process and is still the subject of much research. In simple terms, a cyclone acts like an engine. It converts the energy available from a warm ocean surface into strong vertical air currents and horizontal wind speeds via the evaporation of warm water from the ocean surface and the subsequent condensation of this water vapour in deep columns of cloud around the centre of the storm. This deep cloud often forms an almost circular ring called the eyewall around the very centre of the storm which is itself free from clouds. Thankfully cyclones are rather inefficient engines, converting less than 10% of the available heat energy from condensation in the clouds into the mechanical energy of the motion of the winds.
There is an important positive feedback mechanism which allows cyclones to develop into intense systems. As the system starts to form, evaporation from the ocean surface acts as the source of heat and moisture for the formation of deep clouds. As these clouds intensify, strong rising currents of air in the eyewall around the storm centre. Near the surface, air is drawn into the centre of the storm to replace the rising air. This inrushing air near the surface results in strong winds which increase the evaporation from the ocean surface. This evaporation provides more heat and moisture to the clouds making the rising air currents within them stronger and thus intensifying the surface winds even further. As the system develops the Earth’s rotation acts on the inrushing winds, deflecting them into a pattern that rotates about the centre of the storm, spiralling in towards the centre.
A result of the mechanism for development described here is that the most severe weather, the heaviest rain and strongest winds, is strongly focused in the centre of the cyclone. In Figure 2 the diameter of the almost circular region of cloud associated with a Hurricane is about 800km. However, the most damaging winds and heaviest rain are all concentrated within the innermost 200km of the storm. The physics behind why there is sinking, warming and therefore clear air in the eye of the storm is still an area of active research.

Diagram of a tropical cyclone.© NASA
The decay of a tropical cyclone usually occurs when the source of energy to the storm, the warm ocean surface, is removed. This may be due to the cyclone moving over land or into an ocean region with lower surface temperatures. An increase in vertical wind shear can also bring about the decay of a tropical cyclone.
Courtesy: University of Reading and Royal Meteorological Society
Weather Knowledge - 17
The Jetstream and The Weather
The jet stream is a strong flowing ribbon of air that flows around our planet high up in the atmosphere, at around the level of the tropopause. Situated between the troposphere and the stratosphere, the Jet Stream is approximately 11 kilometres above the surface of the Earth at the poles and around 17 kilometres above the surface of the Earth at the equator. The jet stream flows at around 160kmph (100mph). We often hear that the jet stream is responsible for influencing the weather in the UK, so it is natural to wonder what causes the jet stream and why it has such an influence on the weather we experience on the ground.
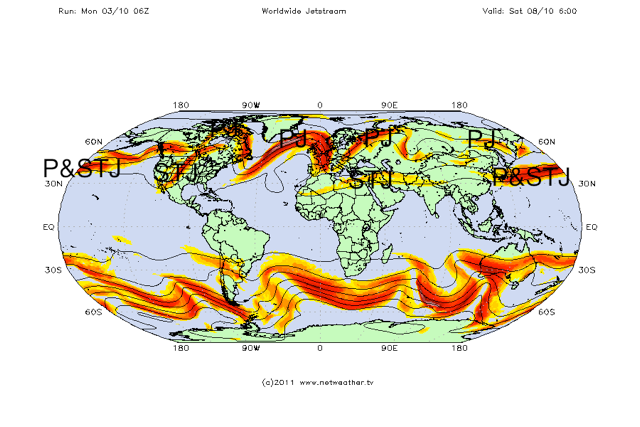
Jet streams form and are strongest where variable air temperature gradients are steepest. This is normally seen in two zones:
- The boundary between the polar and mid latitude air . The Polar Front Jet or Polar jet
- The boundary between the mid latitude air and tropical air . The Subtropical Jet.
See Fig 1. below for an example of a typical jet stream chart across the earth.
Click to enlarge
Influencing factors on the Jet Stream flow
The factors that influence the flow of the jet stream are the landmasses and the Coriolis effect. Landmasses interrupt the flow of the jet stream through friction and temperature differences, whilst the spinning nature of the earth accentuates these changes. So the jet stream meanders across the earth, like a river meanders before it reaches the sea. The meandering sections of the jet stream continue to change as they interact with landmasses once again, creating an ever-changing state of flux and subsequent temperature differences.
In winter the temperature of the stratosphere can also have an effect on the strength and position of the jet stream. The cooler the polar stratosphere, the stronger the polar/ tropical differential becomes; encouraging the jet stream to gain in strength. The warmth of the landmasses and oceans (such as the El Nino Southern Oscillation) can also have a bearing on the strength and amplitude of the jet stream.
Jet Stream Variables
The strongest areas of the jet stream are known as jet streaks. These are areas where the jet stream has increased in speed by as much as 100kmph. A typical jet streak is 160km wide, 2-3 km thick and lasting several hundred km in length. The strongest jet streams are seen where the upper air temperature differentials are greatest, the weakest jet streams appear when the opposite is true. Strong jet streams tend to have very little meandering associated with them whereas weaker jet streams have a considerable amount of meandering associated with them.
A Summary of the Jet Stream
- Jet streams are strong upper air currents circumnavigating the globe.
- There are two main jets: the polar jet and the subtropical jet.
- Jet streams can fluctuate in strength between 100-200mph.
- The jet stream meanders in waves.
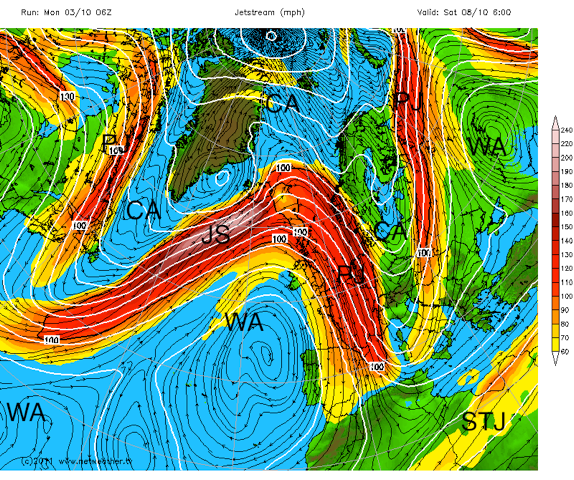
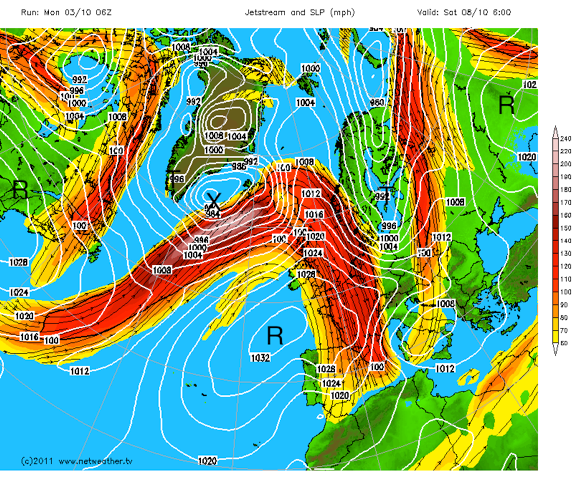
To try explain how the jet stream affects the weather in the UK, it is worth going back to the jet stream chart seen in Fig 1, now zoom in to the jet stream analysis over the Atlantic as seen in Fig 2.
Click to enlarge
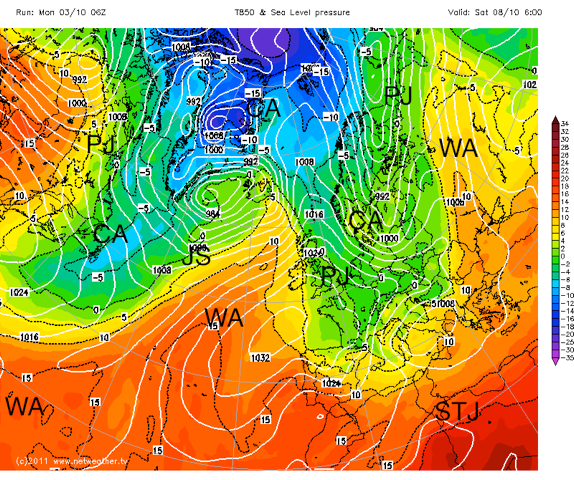
From Fig 2. you can see that the polar front jet meanders across the country in a wave like pattern. These waves introduce pockets of colder air southwards and warmer northwards. The temperature change is demonstrated by looking at the air temperature at a high enough altitude in the atmosphere, where ground and sea temperatures do not affect it .around 1500 metres in altitude where the air pressure is around 850 hPa.
Fig 3. shows how these temperatures match the fluctuations in the jet stream.
Click to enlarge
Furthermore, looking back at FIG 2, the wave pattern associated with the polar jet has distinct peaks (ridges) and troughs. It is no surprise to find that when we overlay the jet stream with a chart showing sea level pressure, that the ridges occur where sea level pressure is highest and the troughs occur where sea level pressure is lowest (as FIG 4 demonstrates). This is because air rises where troughs are situated and sinks where ridges are occur. Rising and sinking parcels of air will therefore determine the type of weather that a region experiences.
Click to enlarge
Look at the area X on Fig 4. which is situated towards the west of Iceland. This is a common cyclonic or baroclinic depression that is caused by the difference in pressure and temperature over a region. This is feeding strength to the jet stream, which is then invigorating the depression.
In contrast, Fig 5 shows the same chart from FIG 2. However, note the following points:
- The circled area is where the jet stream is strongest . the jet streak.
- The purple box marks the winds entering the jet streak.
- The winds leaving the jet streak are marked by the black box.

Click to enlarge
The positioning and strength of the jet stream determines where ridges and troughs are associated and this in turn influences the surface weather.
Zonality and Meridional flow.
During periods when the jet stream is flat and strong with little amplification or meandering, the UK is likely to experience weather that is driven straight in from the Atlantic. This is characterized by wet and windy weather with temperatures near to average. This condition is often termed .zonality. as the warm and cold air masses are clearly defined by a straight fast flowing jet.
During periods when the jet stream is amplified (such as Fig2) the pattern will be different. This is often termed meridional with polar air travelling further south than usual and warmer sub tropical air travelling further north. The exact positioning of the amplification of the jet stream will determine whether or not the UK is in cold polar air or warmer air from lower latitudes. If a meridional pattern becomes stagnant then the UK may experience either of these conditions for a period of time and the pattern may be known as .blocked..
Summary of the Jet Stream and the weather it creates:
- The position of the jet stream over the UK determines the type of weather we experience.
- If the polar front jet is situated significantly to the south of the UK we will experience colder than average weather.
- If the polar front jet is situated to the north of the UK we will experience warmer than average weather.
- If the polar front jet is situated over the UK we will experience wetter and windier than average weather.
- If the polar front jet has a large amplification then cold air will travel further south than average and warm air will travel further north than average.
- The direction and angle of the jet stream arriving at the UK will determine what source of air (i.e. cold, dry, warm, wet, from maritime or continental sources) the UK experiences.
Weather Knowledge - 16
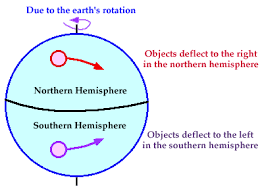
We live on a planet that rotates, so this simple wind pattern is distorted to such a degree that the air is twisted to the right of its direction of motion in the Northern Hemisphere and to the left in the Southern Hemisphere. Today we know this effect as the Coriolis Force and as a direct consequence, great wind spirals are produced which we know as high and low pressure systems.
In the Northern Hemisphere, the air in low pressure areas spirals counterclockwise and inward — hurricanes, for instance, are Coriolis mechanisms, circulating air counterclockwise. In contrast, high pressure systems the air spirals clockwise and outward from the center. In the Southern Hemisphere the direction of the spiraling of the air is reversed.
So why do we generally associate high pressure with fair weather and low pressure with unsettled weather?
High pressure systems are “domes of density” that press down, while low pressure systems are akin to “atmospheric valleys” where the density of the air is less. Since cool air has less of a capacity to hold water vapor as opposed to warm air, clouds and precipitation are caused by cooling the air.
So by increasing the air pressure, the temperature rises; underneath those high pressure domes, the air tends to sink (called “subsidence”) into the lower levels of the atmosphere where temperatures are warmer and can hold more water vapor. Any droplets that might lead to the formation of clouds would tend to evaporate. The end result tends to be a clearer and drier environment.
Conversely, if we decrease the air pressure, the air tends to rise into the higher levels of atmosphere where temperatures are colder. As the capacity to hold water vapor diminishes, the vapor rapidly condenses and clouds (which are composed of countless billions of tiny water droplets or, at very high altitudes, ice crystals) will develop and ultimately precipitation will fall. Of course, we could not forecast zones of high and low pressure without employing some sort of device to measure atmospheric pressure.
Weather Knowledge - 15

Weather Knowledge - 14
What is the coldest place on Earth?
It is a high ridge in Antarctica on the East Antarctic Plateau where temperatures in several hollows can dip below minus 133.6 degrees Fahrenheit (minus 92 degrees Celsius) on a clear winter night.
Scientists made the discovery while analyzing the most detailed global surface temperature maps to date, developed with data from remote sensing satellites including the new Landsat 8, a joint project of NASA and the U.S. Geological Survey (USGS). Ted Scambos, lead scientist at the National Snow and Ice Data Center in Boulder, Colo., joined a team of researchers reporting the findings Monday at the American Geophysical Union meeting in San Francisco.

Researchers analyzed 32 years' worth of data from several satellite instruments. They found temperatures plummeted to record lows dozens of times in clusters of pockets near a high ridge between Dome Argus and Dome Fuji, two summits on the ice sheet known as the East Antarctic Plateau. The new record of minus 136 F (minus 93.2 C) was set Aug. 10, 2010.
That is several degrees colder than the previous low of minus 128.6 F (minus 89.2 C), set in 1983 at the Russian Vostok Research Station in East Antarctica. The coldest permanently inhabited place on Earth is northeastern Siberia, where temperatures in the towns of Verkhoyansk and Oimekon dropped to a bone-chilling 90 degrees below zero Fahrenheit (minus 67.8 C) in 1892 and 1933, respectively.
"We had a suspicion this Antarctic ridge was likely to be extremely cold, and colder than Vostok because it's higher up the hill," Scambos said. "With the launch of Landsat 8, we finally had a sensor capable of really investigating this area in more detail."
The quest to find out just how cold it can get on Earth -- and why -- started when the researchers were studying large snow dunes, sculpted and polished by the wind, on the East Antarctic Plateau. When the scientists looked closer, they noticed cracks in the snow surface between the dunes, possibly created when wintertime temperatures got so low the top snow layer shrunk. This led scientists to wonder what the temperature range was, and prompted them to hunt for the coldest places using data from two types of satellite sensors.

They turned to the Moderate Resolution Imaging Spectroradiometer (MODIS) instruments on NASA's Terra and Aqua satellites and the Advanced Very High Resolution Radiometer (AVHRR) on several National Oceanic and Atmospheric Administration satellites. These sensitive instruments can pick up thermal radiation emitted from Earth's surface, even in areas lacking much heat.
Using these sensors to scan the East Antarctic Plateau, Scambos detected extremely cold temperatures on a 620-mile stretch of the ridge at high elevations between Argus and Fuji, and even colder temperatures lower elevations in pockets off the ridge. Then, with the higher resolution of the Thermal Infrared Sensor (TIRS) aboard Landsat 8, the research team pinpointed the record-setting pockets.
The team compared the sites to topographic maps to explore how it gets so cold. Already cold temperatures fall rapidly when the sky clears. If clear skies persist for a few days, the ground chills as it radiates its remaining heat into space. This creates a layer of super-chilled air above the surface of the snow and ice. This layer of air is denser than the relatively warmer air above it, which causes it to slide down the shallow slope of domes on the Antarctic plateau. As it flows into the pockets, it can be trapped, and the cooling continues.
"By causing the air to be stationary for extended periods, while continuing to radiate more heat away into space, you get the absolute lowest temperatures we're able to find," Scambos said. "We suspected that we would be looking for one magical site that got extremely cold, but what we found was a large strip of Antarctica at high altitude that regularly reached these record low temperatures."

The study is an example of some of the intriguing science possible with Landsat 8 and the TIRS instrument, which was built at NASA’s Goddard Space Flight Center in Greenbelt, Md. Since its launch Feb. 11, Landsat 8 has captured approximately 550 scenes per day of Earth's land surface. USGS processes, archives and distributes the images free of charge over the Internet.
"With Landsat 8, we expect to see more accurate and more detailed maps of the landscape than we've ever been able to see," said James Irons, the mission's project scientist at Goddard. "If change is occurring, I think we'll be able to detect it earlier and track it."
Researchers also are eager to see what new results come out of Landsat 8, both from icy plateaus and Earth's warmer regions.
"What we've got orbiting Earth right now is a very accurate and consistent sensor that can tell us all kinds of things about how the land surface of Earth is changing, how climate change is impacting the surface of Earth, the oceans of Earth, and the icy areas of Earth," Scambos said. "Finding the coldest areas on Earth is just the beginning of the discoveries we're going to be able to make with Landsat 8."
Production editor: Dr. Tony Phillips | Credit: Science@NASA
Weather Knowledge -13
When you hear or see showers on the forecast do you think, there won’t be very much and when you the term rain is used do you think, it will be soaking?
The difference between the two is kind of tricky and subtle. There is no doubt that showers are indeed rain. Taking at face value the term rain or showers, has nothing to do with how much precipitation is going to fall. Instead it tells you how it is going to fall. It has to do with the type of cloud they come from.
What are showers?
A shower is a short duration event, that can last a couple of minutes to perhaps 15 minutes or so. But they can sometime last over half an hour. They typically start quickly and end quickly. There can be heavy downpours when dealing with showers.
Showers come from Cumuliform clouds - Cumulus or Cumulonimbus (thunderstorm) the puffy ones that look like they are bubbling up. often separated by blue sky. Showers are pushed around by the wind, so you only experience a particular shower if you are in its path Since they are hit and miss, your house could be getting wet, while your next-door neighbor could be dry. Cumulus normally result in lower totals while amounts can get quite high from Cumulonimbus.
The customary way of talking about them is isolated showers or scattered/widespread showers. Because they are hit and miss you will never see 100% chance of showers.
Cumulus

Cumulonimbus

Cumulonimbus

What is rain?
Rain is a moderate to long duration event. That can last for a couple of hours to all day. It typically starts gradually then ramps up and ends gradually.
Rain comes from Stratiform clouds- Altostratus and Nimbostratus. These types of clouds are more or less featureless and cover the sky in a grey, widespread sheet, with little to no blue sky to be seen, and of the two, Nimbostratus is thicker and produces heavier rains.
Rain covers a wide area, so most or everyone over a large area are getting wet. Rain can come down lightly or heavily. Because of its long-lasting duration, it can lead to flooding issues.
Altostratus

Nimbostratus

Weather Knowledge -12
Altocumulus with Virga
These are altocumulus clouds with strong upward motion in them producing precipitation, in this case snow, falling in streaks and not reaching the ground (“virga”). They form when the upper troposphere is unstable, and warm advection (a warm air mass moving into a cool air mass) produces the uplift.
Weather Knowledge - 11